WPF Chart - Examples
SciChart WPF ships with hundreds of WPF Chart Examples which you can browse, play with, view the source-code and even export each WPF Chart Example to a stand-alone Visual Studio solution. All of this is possible with the new and improved SciChart WPF Examples Suite, which ships as part of the SciChart WPF SDK.
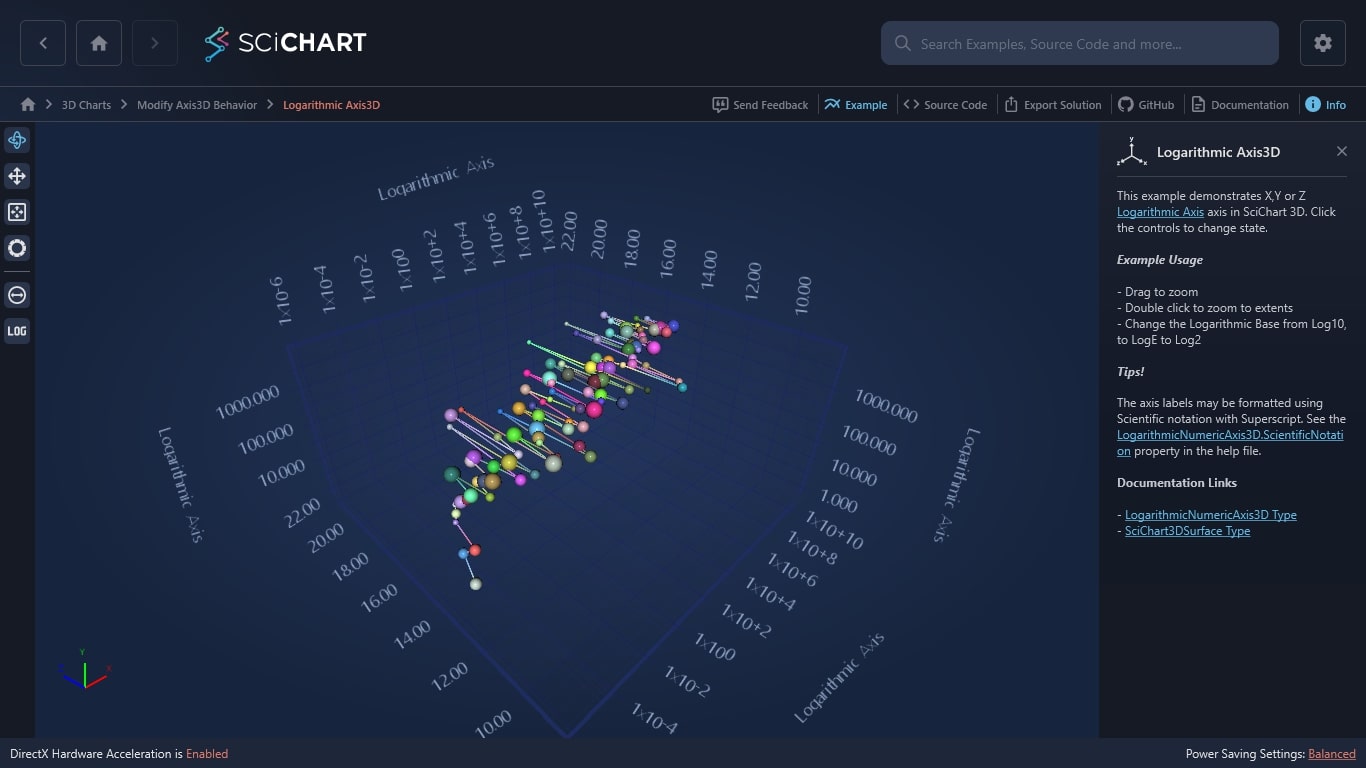
This WPF 3D Chart example demonstrates X,Y or Z Logarithmic Axis axis in SciChart 3D. Click the controls to change state.
Example Usage
– Drag to zoom
– Double click to zoom to extents
– Change the Logarithmic Base from Log10, to LogE to Log2
Tips!
The axis labels may be formatted using Scientific notation with Superscript. See the LogarithmicNumericAxis3D.ScientificNotation property in the help file.
Documentation Links

The C#/WPF source code for the WPF 3D Chart Logarithmic Axis Example example is included below (Scroll down!).
Did you know you can also view the source code from one of the following sources as well?
- Clone the SciChart.WPF.Examples from Github.
- Or, view source in the SciChart WPF Examples suite.
- Also the SciChart WPF Trial contains the full source for the examples (link below).
LogarithmicAxis3DView.xaml
View source code<UserControl x:Class="SciChart.Examples.Examples.Charts3D.CreateA3DChart.LogarithmicAxis3DView"
xmlns="http://schemas.microsoft.com/winfx/2006/xaml/presentation"
xmlns:x="http://schemas.microsoft.com/winfx/2006/xaml"
xmlns:d="http://schemas.microsoft.com/expression/blend/2008"
xmlns:ext="http://schemas.abtsoftware.co.uk/scichart/exampleExternals"
xmlns:mc="http://schemas.openxmlformats.org/markup-compatibility/2006"
xmlns:s3D="http://schemas.abtsoftware.co.uk/scichart3D"
xmlns:system="clr-namespace:System;assembly=mscorlib"
d:DesignHeight="400"
d:DesignWidth="600"
mc:Ignorable="d">
<Grid>
<Grid.ColumnDefinitions>
<ColumnDefinition Width="Auto" />
<ColumnDefinition Width="*" />
</Grid.ColumnDefinitions>
<!-- The SciChart3DInteractionToolbar adds rotate, orbit, zoom, pan, zoom extents functionality -->
<!-- to the chart and is included for example purposes. -->
<!-- If you wish to know how to zoom and pan a 3D chart then do a search for Zoom Pan in the Examples suite! -->
<ext:SciChart3DInteractionToolbar TargetSurface="{Binding Source={x:Reference Name=sciChart}}">
<ext:FlyoutSeparator Background="#444" />
<ext:FlyoutMenuButton Content="SIZE"
Padding="0"
Style="{StaticResource FlyoutMenuButtonStyle}">
<ext:FlyoutMenuButton.PopupContent>
<StackPanel MinWidth="150" Orientation="Vertical">
<TextBlock Text="Slide to change PointMarker Size" />
<ext:FlyoutSeparator />
<!-- Create the size slider -->
<Slider x:Name="sizeSlider"
Margin="4"
HorizontalAlignment="Stretch"
Maximum="3.0"
Minimum="0.1"
Orientation="Horizontal"
Value="2.0" />
</StackPanel>
</ext:FlyoutMenuButton.PopupContent>
</ext:FlyoutMenuButton>
<ext:FlyoutMenuButton Content="LOG"
Padding="0"
Style="{StaticResource FlyoutMenuButtonStyle}">
<ext:FlyoutMenuButton.PopupContent>
<StackPanel MinWidth="150" Orientation="Vertical">
<TextBlock Text="Change Logarithm base property" />
<ComboBox x:Name="logBasesChbx" VerticalAlignment="Center" Margin="4" SelectedIndex="2">
<system:String>2</system:String>
<system:String>5</system:String>
<system:String>10</system:String>
<system:String>E</system:String>
</ComboBox>
</StackPanel>
</ext:FlyoutMenuButton.PopupContent>
</ext:FlyoutMenuButton>
</ext:SciChart3DInteractionToolbar>
<s3D:SciChart3DSurface x:Name="sciChart"
Grid.Column="1"
BorderThickness="0"
WorldDimensions="200,100,200">
<s3D:SciChart3DSurface.RenderableSeries>
<!-- To create a Scatter Chart, create a ScatterRenderableSeries3D and use a 3D point marker type -->
<s3D:PointLineRenderableSeries3D x:Name="pointLineSeries3D"
StrokeThickness="2">
<s3D:PointLineRenderableSeries3D.PointMarker>
<s3D:SpherePointMarker3D Size="{Binding Source={x:Reference Name=sizeSlider}, Path=Value}"/>
</s3D:PointLineRenderableSeries3D.PointMarker>
</s3D:PointLineRenderableSeries3D>
</s3D:SciChart3DSurface.RenderableSeries>
<s3D:SciChart3DSurface.ZAxis>
<s3D:NumericAxis3D GrowBy="0.5, 0.5" />
</s3D:SciChart3DSurface.ZAxis>
<s3D:SciChart3DSurface.YAxis>
<s3D:LogarithmicNumericAxis3D Name="logarithmicNumericYAxis3D"
AxisTitle="Logarithmic Axis"
CursorTextFormatting="0.0"
TextFormatting="#.000"
GrowBy="0.1, 0.1"
ScientificNotation="None"
DrawMajorBands="False"
AxisTitleOffset="65.0" />
</s3D:SciChart3DSurface.YAxis>
<s3D:SciChart3DSurface.XAxis>
<s3D:LogarithmicNumericAxis3D Name="logarithmicNumericXAxis3D"
AxisTitle="Logarithmic Axis"
CursorTextFormatting="0.0"
TextFormatting="#.#E+0"
GrowBy="0.1, 0.1"
ScientificNotation="LogarithmicBase"
DrawMajorBands="False"
AxisTitleOffset="65.0" />
</s3D:SciChart3DSurface.XAxis>
</s3D:SciChart3DSurface>
</Grid>
</UserControl>LogarithmicAxis3DView.xaml.cs
View source code// *************************************************************************************
// SCICHART® Copyright SciChart Ltd. 2011-2022. All rights reserved.
//
// Web: http://www.scichart.com
// Support: support@scichart.com
// Sales: sales@scichart.com
//
// LogarithmicAxis3DView.xaml.cs is part of the SCICHART® Examples. Permission is hereby granted
// to modify, create derivative works, distribute and publish any part of this source
// code whether for commercial, private or personal use.
//
// The SCICHART® examples are distributed in the hope that they will be useful, but
// without any warranty. It is provided "AS IS" without warranty of any kind, either
// expressed or implied.
// *************************************************************************************
using System;
using System.Globalization;
using System.Windows;
using System.Windows.Controls;
using System.Windows.Data;
using System.Windows.Media;
using SciChart.Charting.Visuals.Axes.LogarithmicAxis;
using SciChart.Charting3D.Model;
using SciChart.Examples.ExternalDependencies.Data;
using SciChart.Charting3D.Axis;
namespace SciChart.Examples.Examples.Charts3D.CreateA3DChart
{
public partial class LogarithmicAxis3DView : UserControl
{
public LogarithmicAxis3DView()
{
InitializeComponent();
this.Loaded += OnLoaded;
}
private void OnLoaded(object sender, RoutedEventArgs routedEventArgs)
{
var converter = new LogarithmicBase3DConverter();
var logBinding = new Binding("SelectedValue") { ElementName = "logBasesChbx", Converter = converter };
logarithmicNumericYAxis3D.SetBinding(LogarithmicNumericAxis3D.LogarithmicBaseProperty, logBinding);
logarithmicNumericXAxis3D.SetBinding(LogarithmicNumericAxis3D.LogarithmicBaseProperty, logBinding);
var xyzDataSeries3D = new XyzDataSeries3D<double>();
var data = DataManager.Instance.GetExponentialCurve(1.8, 100);
int count = 100;
var random = new Random(0);
for (int i = 0; i < count; i++)
{
double x = data[i].X;
double y = data[i].Y;
double z = DataManager.Instance.GetGaussianRandomNumber(15, 1.5);
Color? randomColor = Color.FromArgb(0xFF, (byte)random.Next(50, 255), (byte)random.Next(50, 255), (byte)random.Next(50, 255));
float scale = (float)((random.NextDouble() + 0.5) * 3.0);
xyzDataSeries3D.Append(x, y, z, new PointMetadata3D(randomColor, scale));
}
pointLineSeries3D.DataSeries = xyzDataSeries3D;
}
}
public class LogarithmicBase3DConverter : IValueConverter
{
public object Convert(object value, Type targetType, object parameter, CultureInfo culture)
{
var str = (string)value;
var result = str.ToUpperInvariant().Equals("E") ? Math.E : Double.Parse(str, CultureInfo.InvariantCulture);
return result;
}
public object ConvertBack(object value, Type targetType, object parameter, CultureInfo culture)
{
throw new NotImplementedException();
}
}
}
