WPF Chart - Examples
SciChart WPF ships with hundreds of WPF Chart Examples which you can browse, play with, view the source-code and even export each WPF Chart Example to a stand-alone Visual Studio solution. All of this is possible with the new and improved SciChart WPF Examples Suite, which ships as part of the SciChart WPF SDK.
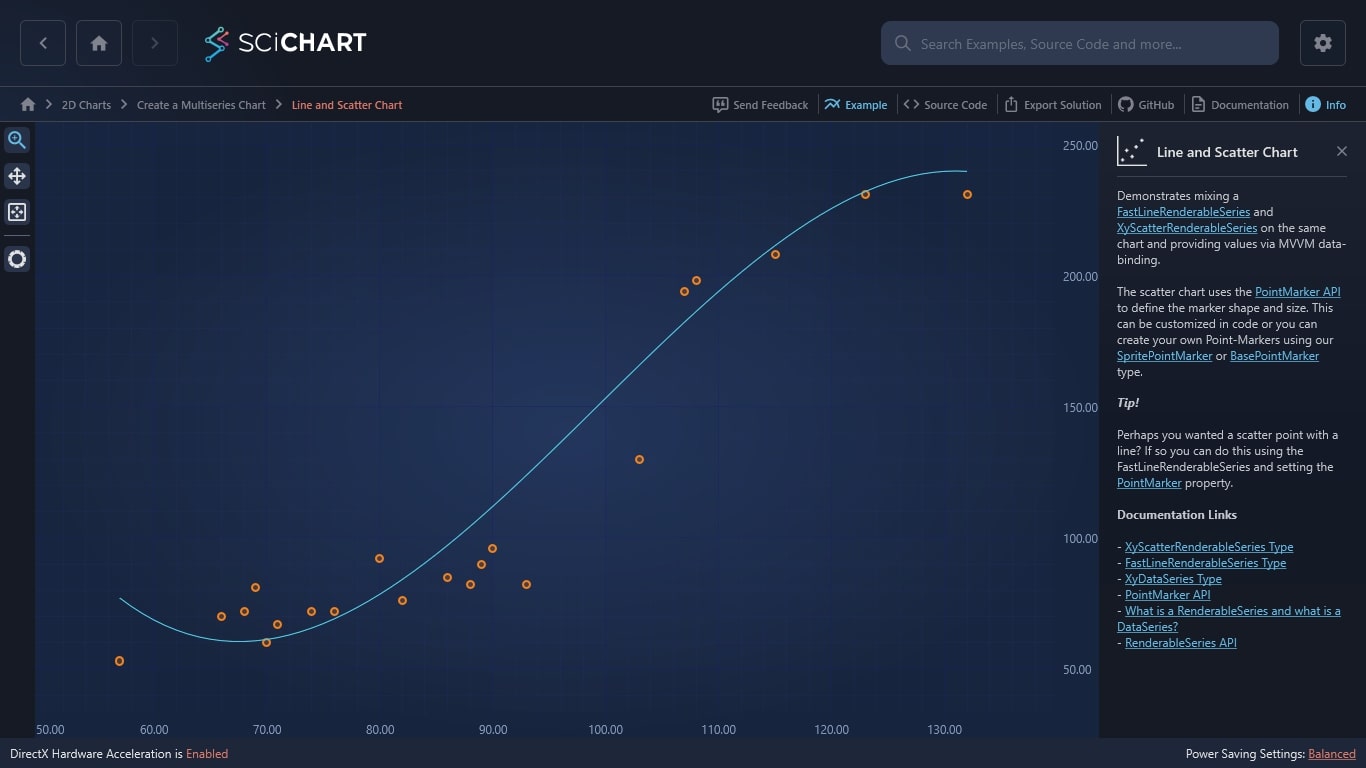
Demonstrates mixing a FastLineRenderableSeries and XyScatterRenderableSeries on the same chart and providing values via MVVM data-binding.
The scatter chart uses the PointMarker API to define the marker shape and size. This can be customized in code or you can create your own Point-Markers using our SpritePointMarker or BasePointMarker type.
Tip!
Perhaps you wanted a scatter point with a line? If so you can do this using the FastLineRenderableSeries and setting the PointMarker property.
Documentation Links
– XyScatterRenderableSeries Type
– FastLineRenderableSeries Type
– XyDataSeries Type
– PointMarker API
– What is a RenderableSeries and what is a DataSeries?
– RenderableSeries API

The C#/WPF source code for the WPF Line and Scatter Chart example is included below (Scroll down!).
Did you know you can also view the source code from one of the following sources as well?
- Clone the SciChart.WPF.Examples from Github.
- Or, view source in the SciChart WPF Examples suite.
- Also the SciChart WPF Trial contains the full source for the examples (link below).
LineAndScatterExampleView.xaml
View source code<UserControl x:Class="SciChart.Examples.Examples.CreateMultiseriesChart.LineAndScatterExampleView"
xmlns="http://schemas.microsoft.com/winfx/2006/xaml/presentation"
xmlns:x="http://schemas.microsoft.com/winfx/2006/xaml"
xmlns:s="http://schemas.abtsoftware.co.uk/scichart"
xmlns:mc="http://schemas.openxmlformats.org/markup-compatibility/2006"
xmlns:d="http://schemas.microsoft.com/expression/blend/2008"
xmlns:ext="http://schemas.abtsoftware.co.uk/scichart/exampleExternals"
d:DesignHeight="400"
d:DesignWidth="600"
mc:Ignorable="d">
<Grid>
<Grid.ColumnDefinitions>
<ColumnDefinition Width="Auto" />
<ColumnDefinition Width="*" />
</Grid.ColumnDefinitions>
<!-- The SciChartInteractionToolbar adds zoom, pan, zoom extents and rotate functionality -->
<!-- to the chart and is included for example purposes. -->
<!-- If you wish to know how to zoom and pan a chart then do a search for Zoom Pan in the Examples suite! -->
<ext:SciChartInteractionToolbar TargetSurface="{Binding Source={x:Reference Name=sciChart}}" />
<!-- Define the chart surface host -->
<s:SciChartSurface Grid.Column="1" x:Name="sciChart" Padding="0" BorderThickness="0">
<s:SciChartSurface.RenderableSeries>
<!-- Series0 is a Scatter Series -->
<s:XyScatterRenderableSeries DataSeries="{Binding ScatterData}">
<s:XyScatterRenderableSeries.PointMarker>
<s:EllipsePointMarker Width="9" Height="9" Fill="#AAFFFFFF" Stroke="SteelBlue" StrokeThickness="2" />
</s:XyScatterRenderableSeries.PointMarker>
<s:XyScatterRenderableSeries.SeriesAnimation>
<s:FadeAnimation AnimationDelay="0:0:1" Duration="0:0:3"/>
</s:XyScatterRenderableSeries.SeriesAnimation>
</s:XyScatterRenderableSeries>
<!-- Series1 is a Line Series -->
<s:FastLineRenderableSeries DataSeries="{Binding FittedData}" Stroke="#279B27" StrokeThickness="1" >
<s:FastLineRenderableSeries.SeriesAnimation>
<s:FadeAnimation AnimationDelay="0:0:1" Duration="0:0:3"/>
</s:FastLineRenderableSeries.SeriesAnimation>
</s:FastLineRenderableSeries>
</s:SciChartSurface.RenderableSeries>
<!-- Define YAxis -->
<s:SciChartSurface.YAxis>
<s:NumericAxis TextFormatting="0.00" GrowBy="0.1, 0.1" DrawMajorBands="True"/>
</s:SciChartSurface.YAxis>
<!-- Define XAxis -->
<s:SciChartSurface.XAxis>
<s:NumericAxis TextFormatting="0.00" GrowBy="0.1, 0.1" DrawMajorBands="True"/>
</s:SciChartSurface.XAxis>
</s:SciChartSurface>
</Grid>
</UserControl>LineAndScatterExampleView.xaml.cs
View source code// *************************************************************************************
// SCICHART® Copyright SciChart Ltd. 2011-2022. All rights reserved.
//
// Web: http://www.scichart.com
// Support: support@scichart.com
// Sales: sales@scichart.com
//
// LineAndScatterExampleView.xaml.cs is part of the SCICHART® Examples. Permission is hereby granted
// to modify, create derivative works, distribute and publish any part of this source
// code whether for commercial, private or personal use.
//
// The SCICHART® examples are distributed in the hope that they will be useful, but
// without any warranty. It is provided "AS IS" without warranty of any kind, either
// expressed or implied.
// *************************************************************************************
using System.Windows.Controls;
namespace SciChart.Examples.Examples.CreateMultiseriesChart
{
public partial class LineAndScatterExampleView : UserControl
{
public LineAndScatterExampleView()
{
InitializeComponent();
}
}
}
LineAndScatterExampleViewModel.cs
View source code// *************************************************************************************
// SCICHART® Copyright SciChart Ltd. 2011-2022. All rights reserved.
//
// Web: http://www.scichart.com
// Support: support@scichart.com
// Sales: sales@scichart.com
//
// LineAndScatterExampleViewModel.cs is part of the SCICHART® Examples. Permission is hereby granted
// to modify, create derivative works, distribute and publish any part of this source
// code whether for commercial, private or personal use.
//
// The SCICHART® examples are distributed in the hope that they will be useful, but
// without any warranty. It is provided "AS IS" without warranty of any kind, either
// expressed or implied.
// *************************************************************************************
using SciChart.Charting.Model.DataSeries;
using SciChart.Examples.ExternalDependencies.Common;
namespace SciChart.Examples.Examples.CreateMultiseriesChart
{
public class LineAndScatterExampleViewModel : BaseViewModel
{
private readonly double[] _scatterY =
{
53, double.NaN, double.NaN, double.NaN, double.NaN, double.NaN, double.NaN, double.NaN, double.NaN, 70,
double.NaN, 72, 81, 60, 67, double.NaN, double.NaN, 72, double.NaN, 72, double.NaN, double.NaN, double.NaN,
92, double.NaN, 76, double.NaN, double.NaN, double.NaN, 85, double.NaN, 82, 90, 96, double.NaN, double.NaN,
82, double.NaN, double.NaN, double.NaN, double.NaN, double.NaN, double.NaN, double.NaN, double.NaN,
double.NaN, 130, double.NaN, double.NaN, double.NaN, 194, 198, double.NaN, double.NaN, double.NaN,
double.NaN, double.NaN, double.NaN, 208, double.NaN, double.NaN, double.NaN, double.NaN, double.NaN,
double.NaN, double.NaN, 231, double.NaN, double.NaN, double.NaN, double.NaN, double.NaN, double.NaN,
double.NaN, double.NaN, 231
};
private readonly double[] _lineY =
{
77.033282491478, 73.9085208618748, 71.1324976363107, 68.6967626265043,
66.5928656441749, 64.8123565010411, 63.3467850088222, 62.187700979237, 61.3266542240045, 60.7551945548437,
60.4648717834736, 60.447235721613, 60.6938361809811, 61.1962229732969, 61.9459459102786, 62.9345548036464,
64.1535994651183, 65.5946297064143, 67.2491953392517, 69.1088461753512, 71.1651320264308, 73.4096027042101,
75.833808020407, 78.4292977867417, 81.1876218149323, 84.1003299166986, 87.1589719037584, 90.3550975878318,
93.6802567806369, 97.1259992938938, 100.68387493932, 104.345433528635, 108.102224873559, 111.94579878581,
115.867705077105, 119.859493559167, 123.912714043712, 128.01891634246, 132.16965026713, 136.35646562944,
140.57091224111, 144.80453991386, 149.048898459406, 153.295537689469, 157.536007415769, 161.761857450022,
165.964637603949, 170.135897689268, 174.2671875177, 178.350056900961, 182.376055650773, 186.336733578852,
190.223640496919, 194.028326216692, 197.74234054989, 201.357233308233, 204.864554303439, 208.255853347227,
211.522680251317, 214.656584827426, 217.649116887275, 220.491826242582, 223.176262705066, 225.693976086446,
228.036516198441, 230.19543285277, 232.162275861152, 233.928595035306, 235.485940186951, 236.825861127806,
237.939907669589, 238.81962962402, 239.456576802818, 239.842299017702, 239.968346080391, 239.826267802603
};
private IUniformXyDataSeries<double> _scatterData;
private IUniformXyDataSeries<double> _fittedData;
public LineAndScatterExampleViewModel()
{
GenerateData();
}
public IUniformXyDataSeries<double> ScatterData
{
get => _scatterData;
set
{
if (_scatterData == value) return;
_scatterData = value;
OnPropertyChanged("ScatterData");
}
}
public IUniformXyDataSeries<double> FittedData
{
get => _fittedData;
set
{
if (_fittedData == value) return;
_fittedData = value;
OnPropertyChanged("FittedData");
}
}
private void GenerateData()
{
_scatterData = new UniformXyDataSeries<double>(57d, 1d);
_fittedData = new UniformXyDataSeries<double>(57d, 1d);
_scatterData.Append(_scatterY);
_fittedData.Append(_lineY);
}
}
}