WPF Chart - Examples
SciChart WPF ships with hundreds of WPF Chart Examples which you can browse, play with, view the source-code and even export each WPF Chart Example to a stand-alone Visual Studio solution. All of this is possible with the new and improved SciChart WPF Examples Suite, which ships as part of the SciChart WPF SDK.
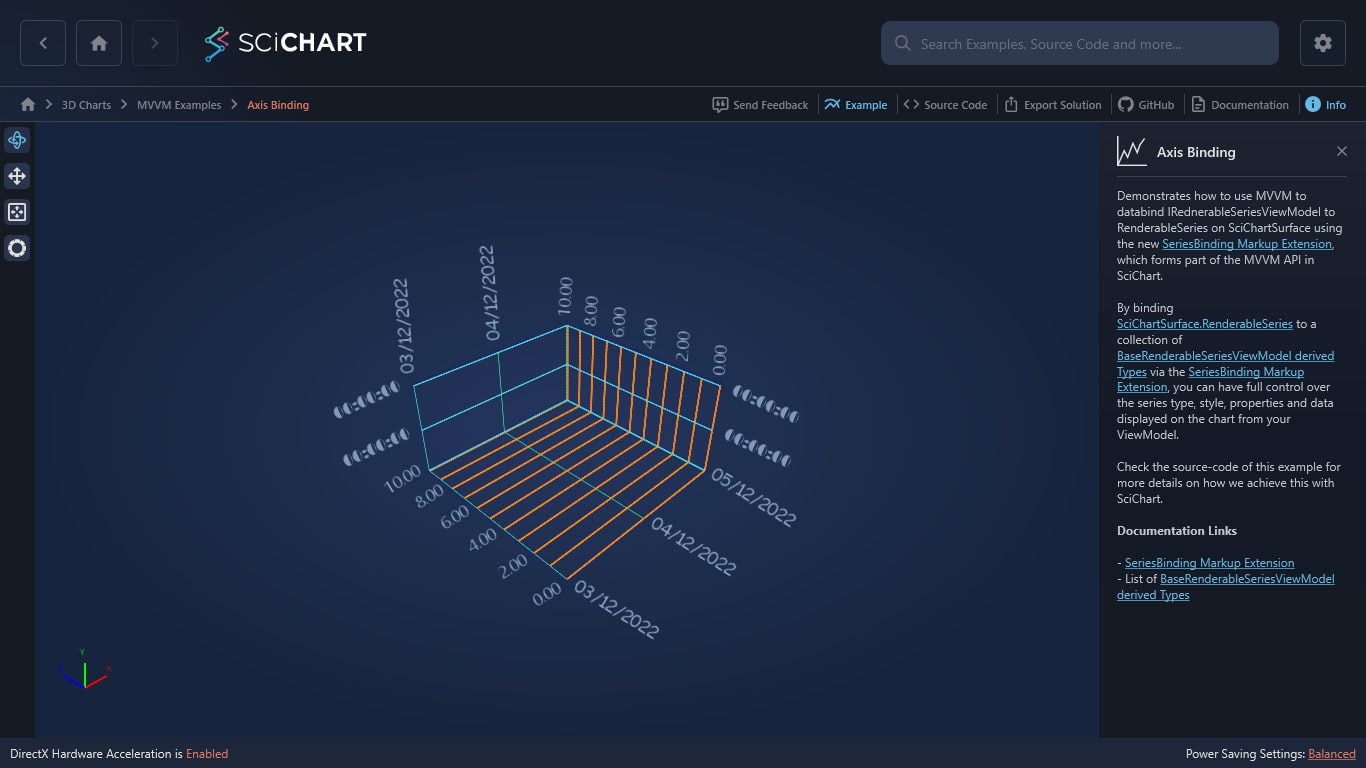
Demonstrates how to use MVVM to databind IRednerableSeriesViewModel to RenderableSeries on SciChartSurface using the new SeriesBinding Markup Extension, which forms part of the MVVM API in SciChart.
By binding SciChartSurface.RenderableSeries to a collection of BaseRenderableSeriesViewModel derived Types via the SeriesBinding Markup Extension, you can have full control over the series type, style, properties and data displayed on the chart from your ViewModel.
Check the source-code of this example for more details on how we achieve this with SciChart.
Documentation Links
– SeriesBinding Markup Extension
– List of BaseRenderableSeriesViewModel derived Types

The C#/WPF source code for the WPF Axis Binding MVVM 3D example is included below (Scroll down!).
Did you know you can also view the source code from one of the following sources as well?
- Clone the SciChart.WPF.Examples from Github.
- Or, view source in the SciChart WPF Examples suite.
- Also the SciChart WPF Trial contains the full source for the examples (link below).
AxisBindingAndSeriesBindingView.xam
View source code<UserControl x:Class="SciChart.Examples.Examples.Charts3D.SciChartWithMvvm.AxisBindingAndSeriesBinding"
xmlns="http://schemas.microsoft.com/winfx/2006/xaml/presentation"
xmlns:x="http://schemas.microsoft.com/winfx/2006/xaml"
xmlns:mc="http://schemas.openxmlformats.org/markup-compatibility/2006"
xmlns:d="http://schemas.microsoft.com/expression/blend/2008"
xmlns:ext="http://schemas.abtsoftware.co.uk/scichart/exampleExternals"
xmlns:s3D="http://schemas.abtsoftware.co.uk/scichart3D"
xmlns:extensions="clr-namespace:SciChart.Charting3D.Common.Extensions;assembly=SciChart.Charting3D"
xmlns:axis="clr-namespace:SciChart.Charting3D.Visuals.Axis;assembly=SciChart.Charting3D"
xmlns:sciChartWithMvvm="clr-namespace:SciChart.Examples.Examples.Charts3D.SciChartWithMvvm"
mc:Ignorable="d"
d:DesignHeight="300"
d:DesignWidth="300">
<UserControl.DataContext>
<sciChartWithMvvm:AxisBindingAndSeriesBindingViewModel/>
</UserControl.DataContext>
<UserControl.Resources>
<Style x:Key="CustomNumeric3DStyle" BasedOn="{StaticResource {x:Type axis:NumericAxis3DForMvvm}}" TargetType="axis:NumericAxis3DForMvvm">
<Setter Property="MajorGridLineStyle">
<Setter.Value>
<Style TargetType="Line">
<Setter Property="Stroke" Value="Chocolate"/>
<Setter Property="StrokeThickness" Value="3" />
</Style>
</Setter.Value>
</Setter>
</Style>
<Style x:Key="CustomTimeSpan3DStyle" BasedOn="{StaticResource {x:Type axis:TimeSpanAxis3DForMvvm}}" TargetType="axis:TimeSpanAxis3DForMvvm">
<Setter Property="MajorGridLineStyle">
<Setter.Value>
<Style TargetType="Line">
<Setter Property="Stroke" Value="GreenYellow"/>
<Setter Property="StrokeThickness" Value="2" />
</Style>
</Setter.Value>
</Setter>
</Style>
<Style x:Key="CustomDateTime3DStyle" BasedOn="{StaticResource {x:Type axis:DateTimeAxis3DForMvvm}}" TargetType="axis:DateTimeAxis3DForMvvm">
<Setter Property="MajorGridLineStyle">
<Setter.Value>
<Style TargetType="Line">
<Setter Property="Stroke" Value="OrangeRed"/>
<Setter Property="StrokeThickness" Value="1" />
</Style>
</Setter.Value>
</Setter>
</Style>
</UserControl.Resources>
<Grid>
<Grid.ColumnDefinitions>
<ColumnDefinition Width="Auto" />
<ColumnDefinition Width="*" />
</Grid.ColumnDefinitions>
<!-- The SciChart3DInteractionToolbar adds rotate, orbit, zoom, pan, zoom extents functionality -->
<!-- to the chart and is included for example purposes. -->
<!-- If you wish to know how to zoom and pan a 3D chart then do a search for Zoom Pan in the Examples suite! -->
<ext:SciChart3DInteractionToolbar TargetSurface="{Binding Source={x:Reference Name=SciChart}}"/>
<s3D:SciChart3DSurface x:Name="SciChart"
Grid.Column="1"
BorderThickness="0"
WorldDimensions="200,100,200"
XAxis="{extensions:AxisBinding XAxis}"
YAxis="{extensions:AxisBinding YAxis}"
ZAxis="{extensions:AxisBinding ZAxis}">
<s3D:SciChart3DSurface.Camera>
<s3D:Camera3D ZoomToFitOnAttach="True" />
</s3D:SciChart3DSurface.Camera>
<s3D:SciChart3DSurface.ChartModifier>
<s3D:ZoomExtentsModifier3D AutoFitRadius="True" AnimateDurationMs = "500"/>
</s3D:SciChart3DSurface.ChartModifier>
</s3D:SciChart3DSurface>
</Grid>
</UserControl>AxisBindingAndSeriesBindingView.xaml.cs
View source codeusing System.Windows.Controls;
namespace SciChart.Examples.Examples.Charts3D.SciChartWithMvvm
{
/// <summary>
/// Interaction logic for AxisBindingAndSeriesBinding.xaml
/// </summary>
public partial class AxisBindingAndSeriesBinding : UserControl
{
public AxisBindingAndSeriesBinding()
{
InitializeComponent();
}
}
}
AxisBindingAndSeriesBindingViewModel.cs
View source code// *************************************************************************************
// SCICHART® Copyright SciChart Ltd. 2011-2022. All rights reserved.
//
// Web: http://www.scichart.com
// Support: support@scichart.com
// Sales: sales@scichart.com
//
// SelectScatterPoint3DChart.xaml.cs is part of the SCICHART® Examples. Permission is hereby granted
// to modify, create derivative works, distribute and publish any part of this source
// code whether for commercial, private or personal use.
//
// The SCICHART® examples are distributed in the hope that they will be useful, but
// without any warranty. It is provided "AS IS" without warranty of any kind, either
// expressed or implied.
// *************************************************************************************
using System.Windows.Media;
using SciChart.Charting3D.Model.ChartSeries;
using SciChart.Examples.ExternalDependencies.Common;
namespace SciChart.Examples.Examples.Charts3D.SciChartWithMvvm
{
public class AxisBindingAndSeriesBindingViewModel : BaseViewModel
{
public AxisBindingAndSeriesBindingViewModel()
{
YAxis = new TimeSpanAxis3DViewModel
{
StyleKey = "CustomTimeSpan3DStyle",
FontFamily = new FontFamily("Broadway")
};
XAxis = new DateTimeAxis3DViewModel
{
StyleKey = "CustomDateTime3DStyle",
FontFamily = new FontFamily("Comic sans ms")
};
ZAxis = new NumericAxis3DViewModel
{
StyleKey = "CustomNumeric3DStyle"
};
}
public AxisBase3DViewModel XAxis { get; set; }
public AxisBase3DViewModel YAxis { get; set; }
public AxisBase3DViewModel ZAxis { get; set; }
}
}