WPF Chart - Examples
SciChart WPF ships with hundreds of WPF Chart Examples which you can browse, play with, view the source-code and even export each WPF Chart Example to a stand-alone Visual Studio solution. All of this is possible with the new and improved SciChart WPF Examples Suite, which ships as part of the SciChart WPF SDK.
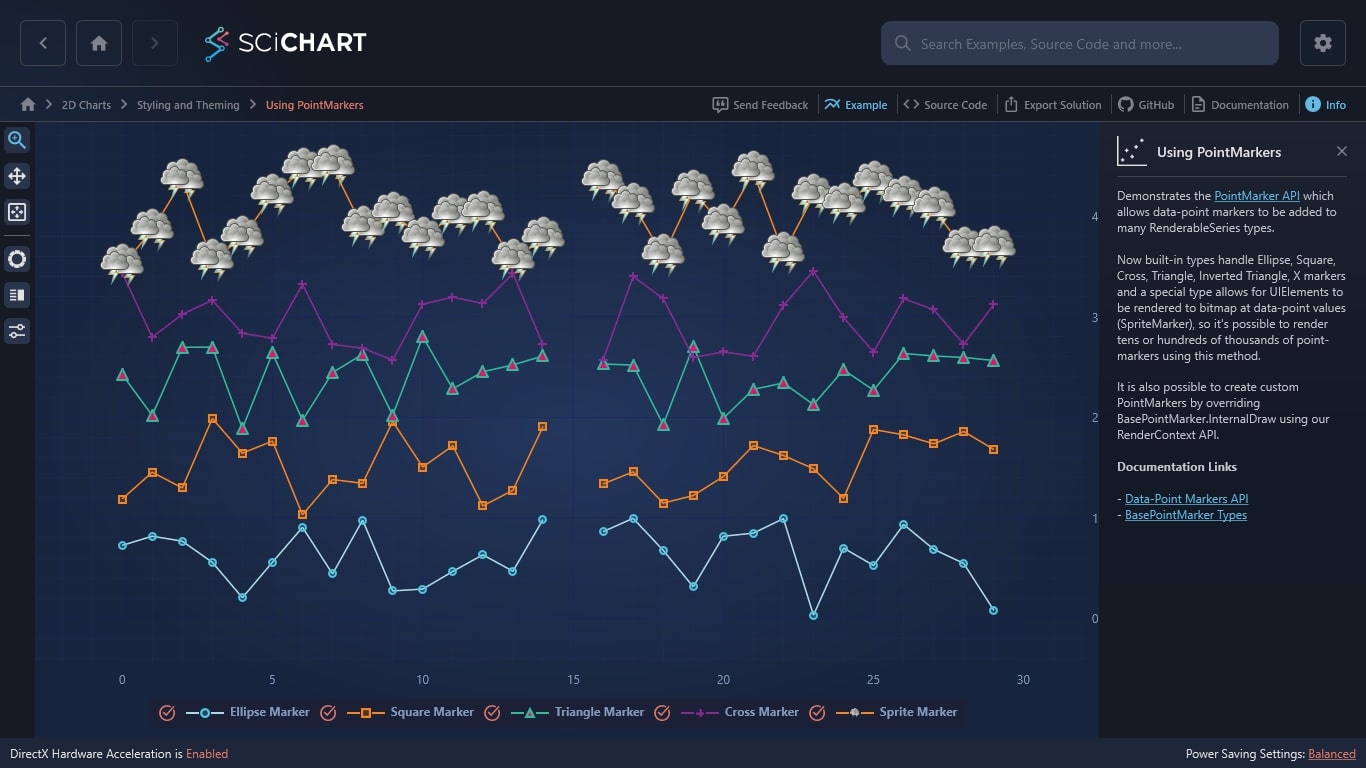
This WPF Scatter Line Point Marker Chart is one of our many WPF Charts and demonstrates the PointMarker API which allows data-point markers to be added to many RenderableSeries types.
Now built-in types handle Ellipse, Square, Cross, Triangle, Inverted Triangle, X markers and a special type allows for UIElements to be rendered to bitmap at data-point values (SpriteMarker), so it’s possible to render tens or hundreds of thousands of point-markers using this method.
It is also possible to create custom PointMarkers by overriding BasePointMarker.InternalDraw using our RenderContext API.
Documentation Links

The C#/WPF source code for the WPF Chart Using PointMarkers example is included below (Scroll down!).
Did you know you can also view the source code from one of the following sources as well?
- Clone the SciChart.WPF.Examples from Github.
- Or, view source in the SciChart WPF Examples suite.
- Also the SciChart WPF Trial contains the full source for the examples (link below).
UsePointMarkers.xaml
View source code<UserControl x:Class="SciChart.Examples.Examples.StyleAChart.UsePointMarkers"
xmlns="http://schemas.microsoft.com/winfx/2006/xaml/presentation"
xmlns:x="http://schemas.microsoft.com/winfx/2006/xaml"
xmlns:d="http://schemas.microsoft.com/expression/blend/2008"
xmlns:ext="http://schemas.abtsoftware.co.uk/scichart/exampleExternals"
xmlns:mc="http://schemas.openxmlformats.org/markup-compatibility/2006"
xmlns:s="http://schemas.abtsoftware.co.uk/scichart"
Loaded="UsePointMarkers_OnLoaded"
d:DesignHeight="400"
d:DesignWidth="600"
mc:Ignorable="d">
<UserControl.Resources>
<ResourceDictionary>
<ResourceDictionary.MergedDictionaries>
<!-- This external resource dictionary defines a ControlTemplate which we will transform into -->
<!-- a sprite for use in our SpritePointMarker below. This can take any WPF control template and -->
<!-- renders it to bitmap once, for repeated blitting on the screen. Note you cannot use triggers or -->
<!-- bindings in a SpritePointMarkers' template -->
<ResourceDictionary Source="UsePointMarkersResourceDictionary.xaml" />
<ResourceDictionary Source="/SciChart.Examples.ExternalDependencies;component/Resources/Styles/ToolbarButtonsCommon.xaml" />
</ResourceDictionary.MergedDictionaries>
<ext:BoolToValueConverter x:Key="BoolToVisibilityConverter"
FalseValue="Collapsed"
TrueValue="Visible" />
</ResourceDictionary>
</UserControl.Resources>
<Grid>
<Grid.ColumnDefinitions>
<ColumnDefinition Width="Auto" />
<ColumnDefinition Width="*" />
</Grid.ColumnDefinitions>
<!-- Define the Toolbar -->
<ext:SciChartInteractionToolbar x:Name="UserToolbar" TargetSurface="{Binding Source={x:Reference Name=sciChart}}">
<ext:FlyoutMenuButton Content="PS"
Padding="0"
Style="{StaticResource FlyoutMenuButtonStyle}"
Visibility="{Binding ElementName=UserToolbar, Path=IsDeveloperMode,
Converter={StaticResource BoolToVisibilityConverter}}">
<ext:FlyoutMenuButton.PopupContent>
<StackPanel MinWidth="150" Orientation="Vertical">
<TextBlock Text="PointMarker Width" />
<Slider x:Name="WidthSlider"
Margin="4"
HorizontalAlignment="Stretch"
Maximum="25"
Minimum="2"
Orientation="Horizontal"
Value="9"/>
<ext:FlyoutSeparator />
<TextBlock Text="PointMarker Height" />
<Slider x:Name="HeightSlider"
Margin="4"
HorizontalAlignment="Stretch"
Maximum="25"
Minimum="2"
Orientation="Horizontal"
Value="9"/>
<ext:FlyoutSeparator />
<TextBlock Text="PointMarker StrokeThickness " />
<Slider x:Name="StrokeThicknessSlider"
Margin="4"
HorizontalAlignment="Stretch"
Maximum="5"
Minimum="1"
Orientation="Horizontal"
Value="2" />
</StackPanel>
</ext:FlyoutMenuButton.PopupContent>
</ext:FlyoutMenuButton>
</ext:SciChartInteractionToolbar>
<!-- Create the chart surface -->
<s:SciChartSurface Name="sciChart" Grid.Column="1">
<!-- Declare RenderableSeries -->
<s:SciChartSurface.RenderableSeries>
<s:FastLineRenderableSeries x:Name="lineSeries1"
Stroke="LightBlue"
StrokeThickness="2">
<s:FastLineRenderableSeries.PointMarker>
<s:EllipsePointMarker Width="{Binding Source={x:Reference WidthSlider}, Path=Value}"
Height="{Binding Source={x:Reference HeightSlider},
Path=Value}"
Fill="#990077FF"
Stroke="LightBlue"
StrokeThickness="{Binding Source={x:Reference Name=StrokeThicknessSlider},
Path=Value}" />
</s:FastLineRenderableSeries.PointMarker>
<s:FastLineRenderableSeries.SeriesAnimation>
<s:FadeAnimation AnimationDelay="0:0:1" Duration="0:0:3"/>
</s:FastLineRenderableSeries.SeriesAnimation>
</s:FastLineRenderableSeries>
<s:FastLineRenderableSeries x:Name="lineSeries2"
Stroke="Red"
StrokeThickness="2">
<s:FastLineRenderableSeries.PointMarker>
<s:SquarePointMarker Width="{Binding Source={x:Reference WidthSlider},
Path=Value}"
Height="{Binding Source={x:Reference HeightSlider},
Path=Value}"
Fill="#99FF0000"
Stroke="Red"
StrokeThickness="{Binding Source={x:Reference Name=StrokeThicknessSlider},
Path=Value}" />
</s:FastLineRenderableSeries.PointMarker>
<s:FastLineRenderableSeries.SeriesAnimation>
<s:FadeAnimation AnimationDelay="0:0:1" Duration="0:0:3"/>
</s:FastLineRenderableSeries.SeriesAnimation>
</s:FastLineRenderableSeries>
<s:FastLineRenderableSeries x:Name="lineSeries3"
Stroke="Yellow"
StrokeThickness="2">
<s:FastLineRenderableSeries.PointMarker>
<s:TrianglePointMarker Width="{Binding Source={x:Reference WidthSlider},
Path=Value}"
Height="{Binding Source={x:Reference HeightSlider},
Path=Value}"
Fill="#FFDD00"
Stroke="#FF6600"
StrokeThickness="{Binding Source={x:Reference Name=StrokeThicknessSlider},
Path=Value}" />
</s:FastLineRenderableSeries.PointMarker>
<s:FastLineRenderableSeries.SeriesAnimation>
<s:FadeAnimation AnimationDelay="0:0:1" Duration="0:0:3"/>
</s:FastLineRenderableSeries.SeriesAnimation>
</s:FastLineRenderableSeries>
<s:FastLineRenderableSeries x:Name="lineSeries4"
Stroke="Magenta"
StrokeThickness="2">
<s:FastLineRenderableSeries.PointMarker>
<s:CrossPointMarker Width="{Binding Source={x:Reference WidthSlider},
Path=Value}"
Height="{Binding Source={x:Reference HeightSlider},
Path=Value}"
Stroke="Magenta"
StrokeThickness="{Binding Source={x:Reference Name=StrokeThicknessSlider},
Path=Value}" />
</s:FastLineRenderableSeries.PointMarker>
<s:FastLineRenderableSeries.SeriesAnimation>
<s:FadeAnimation AnimationDelay="0:0:1" Duration="0:0:3"/>
</s:FastLineRenderableSeries.SeriesAnimation>
</s:FastLineRenderableSeries>
<s:FastLineRenderableSeries x:Name="lineSeries5"
Stroke="Wheat"
StrokeThickness="2">
<s:FastLineRenderableSeries.PointMarker>
<s:SpritePointMarker PointMarkerTemplate="{StaticResource AnyWpfControlTemplateCanGoHere}"/>
</s:FastLineRenderableSeries.PointMarker>
<s:FastLineRenderableSeries.SeriesAnimation>
<s:FadeAnimation AnimationDelay="0:0:1" Duration="0:0:3"/>
</s:FastLineRenderableSeries.SeriesAnimation>
</s:FastLineRenderableSeries>
</s:SciChartSurface.RenderableSeries>
<!-- Create an X Axis with Growby -->
<s:SciChartSurface.XAxis>
<s:NumericAxis GrowBy="0.1, 0.1" />
</s:SciChartSurface.XAxis>
<!-- Create a Y Axis with Growby -->
<s:SciChartSurface.YAxis>
<s:NumericAxis GrowBy="0.1, 0.1" />
</s:SciChartSurface.YAxis>
<s:SciChartSurface.ChartModifier>
<s:ModifierGroup>
<s:MouseWheelZoomModifier />
<s:LegendModifier Margin="10"
HorizontalAlignment="Center"
LegendPlacement="Bottom"
Orientation="Horizontal"
ShowLegend="True" />
</s:ModifierGroup>
</s:SciChartSurface.ChartModifier>
</s:SciChartSurface>
</Grid>
</UserControl>
UsePointMarkers.xaml.cs
View source code// *************************************************************************************
// SCICHART® Copyright SciChart Ltd. 2011-2022. All rights reserved.
//
// Web: http://www.scichart.com
// Support: support@scichart.com
// Sales: sales@scichart.com
//
// UsePointMarkers.xaml.cs is part of the SCICHART® Examples. Permission is hereby granted
// to modify, create derivative works, distribute and publish any part of this source
// code whether for commercial, private or personal use.
//
// The SCICHART® examples are distributed in the hope that they will be useful, but
// without any warranty. It is provided "AS IS" without warranty of any kind, either
// expressed or implied.
// *************************************************************************************
using System;
using System.Windows;
using System.Windows.Controls;
using SciChart.Charting.Model.DataSeries;
namespace SciChart.Examples.Examples.StyleAChart
{
public partial class UsePointMarkers : UserControl
{
public UsePointMarkers()
{
InitializeComponent();
}
private void UsePointMarkers_OnLoaded(object sender, RoutedEventArgs e)
{
var dataSeries1 = new UniformXyDataSeries<double> { SeriesName = "Ellipse Marker" };
var dataSeries2 = new UniformXyDataSeries<double> { SeriesName = "Square Marker" };
var dataSeries3 = new UniformXyDataSeries<double> { SeriesName = "Triangle Marker" };
var dataSeries4 = new UniformXyDataSeries<double> { SeriesName = "Cross Marker" };
var dataSeries5 = new UniformXyDataSeries<double> { SeriesName = "Sprite Marker" };
const int dataSize = 30;
var rnd = new Random(0);
for (int i = 0; i < dataSize; i++) dataSeries1.Append(rnd.NextDouble());
for (int i = 0; i < dataSize; i++) dataSeries2.Append(1 + rnd.NextDouble());
for (int i = 0; i < dataSize; i++) dataSeries3.Append(1.8 + rnd.NextDouble());
for (int i = 0; i < dataSize; i++) dataSeries4.Append(2.5 + rnd.NextDouble());
for (int i = 0; i < dataSize; i++) dataSeries5.Append(3.5 + rnd.NextDouble());
// insert a break into the line - we do this to test double.NaN for the point marker types
dataSeries1.Update(15, double.NaN);
dataSeries2.Update(15, double.NaN);
dataSeries3.Update(15, double.NaN);
dataSeries4.Update(15, double.NaN);
dataSeries5.Update(15, double.NaN);
using (sciChart.SuspendUpdates())
{
lineSeries1.DataSeries = dataSeries1;
lineSeries2.DataSeries = dataSeries2;
lineSeries3.DataSeries = dataSeries3;
lineSeries4.DataSeries = dataSeries4;
lineSeries5.DataSeries = dataSeries5;
}
sciChart.ZoomExtents();
}
}
}UsePointMarkersResourceDictionary.xaml
View source code<ResourceDictionary xmlns="http://schemas.microsoft.com/winfx/2006/xaml/presentation"
xmlns:x="http://schemas.microsoft.com/winfx/2006/xaml">
<ControlTemplate x:Key="AnyWpfControlTemplateCanGoHere">
<Canvas Width="44.0143127441406" Height="45.9999697804451" xmlns="http://schemas.microsoft.com/winfx/2006/xaml/presentation" xmlns:x="http://schemas.microsoft.com/winfx/2006/xaml">
<Canvas Canvas.Left="-1.97962951660156" Canvas.Top="-1.99951171875">
<Canvas>
<Canvas>
<Path Data="F1M311.5,-242.99998C308.72758,-242.99998 306.39177,-241.42627 305.09375,-239.18748 304.14939,-239.66252 303.12856,-239.99998 302,-239.99998 298.136,-239.99998 295,-236.86398 295,-232.99998 295,-229.13598 298.136,-225.99998 302,-225.99998 304.41967,-225.99998 306.43009,-227.3193 307.6875,-229.18748 308.8217,-228.49786 310.07648,-227.99998 311.5,-227.99998 312.41312,-227.99998 313.25295,-228.232 314.0625,-228.53123 314.57244,-227.6635 315.24162,-226.95151 316.0625,-226.37498 316.05526,-226.2446 316,-226.13216 316,-225.99998 316,-222.13598 319.13599,-218.99998 323,-218.99998 326.864,-218.99998 330,-222.13598 330,-225.99998 330,-228.36967 328.74102,-230.35832 326.9375,-231.62498 326.94474,-231.75536 327,-231.8678 327,-231.99998 327,-235.86398 323.86401,-238.99998 320,-238.99998 319.3773,-238.99998 318.82481,-238.77779 318.25,-238.62498 317.05547,-241.18382 314.50866,-242.99998 311.5,-242.99998z" Fill="#FF555753" Stroke="{x:Null}" StrokeThickness="1" />
<Path Data="F1M311.5,-241.99998C308.71952,-241.99998 306.36549,-240.23813 305.4375,-237.78123 304.45208,-238.49067 303.30607,-238.99998 302,-238.99998 298.688,-238.99998 296,-236.31198 296,-232.99998 296,-229.68798 298.688,-226.99998 302,-226.99998 304.42775,-226.99998 306.49324,-228.45556 307.4375,-230.53123 308.55826,-229.61367 309.93964,-228.99998 311.5,-228.99998 312.57454,-228.99998 313.54428,-229.31894 314.4375,-229.78123 314.8359,-228.78147 315.53864,-227.99491 316.375,-227.34373 316.19499,-226.74811 316,-226.15408 316,-225.49998 316,-221.91198 318.912,-218.99998 322.5,-218.99998 326.088,-218.99998 329,-221.91198 329,-225.49998 329,-227.86077 327.66567,-229.83017 325.78125,-230.96873 325.84384,-231.31596 326,-231.63481 326,-231.99998 326,-235.31198 323.312,-237.99998 320,-237.99998 319.14702,-237.99998 318.3287,-237.8213 317.59375,-237.49998 316.73998,-240.09386 314.37851,-241.99997 311.5,-241.99998z" Stroke="{x:Null}" StrokeThickness="1">
<Path.Fill>
<LinearGradientBrush StartPoint="297.50261,-237.30591" EndPoint="335.36395,-224.26862" MappingMode="Absolute" SpreadMethod="Pad">
<LinearGradientBrush.GradientStops>
<GradientStop Color="#FFFFFFFF" Offset="0" />
<GradientStop Color="#00FFFFFF" Offset="1" />
</LinearGradientBrush.GradientStops>
</LinearGradientBrush>
</Path.Fill>
</Path>
<Path Data="F1M248.54804,-383.6666A6.7396116,6.7396116,0,1,1,235.06881,-383.6666A6.7396116,6.7396116,0,1,1,248.54804,-383.6666z" Fill="#FF888A85" Stroke="{x:Null}" StrokeThickness="1">
<Path.RenderTransform>
<MatrixTransform Matrix="0.964447021484375,0,0,0.964447021484375,89.2885208129883,144.52619934082" />
</Path.RenderTransform>
</Path>
<Canvas>
<Path Data="F1M250.18322,-389.30136A6.2313786,6.2313786,0,1,1,237.72046,-389.30136A6.2313786,6.2313786,0,1,1,250.18322,-389.30136z" Fill="#FF888A85" Stroke="{x:Null}" StrokeThickness="1">
<Path.RenderTransform>
<MatrixTransform Matrix="0.882629990577698,0,0,0.882629990577698,96.180778503418,108.109100341797" />
</Path.RenderTransform>
</Path>
<Path Data="F1M250.18322,-389.30136A6.2313786,6.2313786,0,1,1,237.72046,-389.30136A6.2313786,6.2313786,0,1,1,250.18322,-389.30136z" Stroke="{x:Null}" StrokeThickness="1" Opacity="0.4944444">
<Path.Fill>
<LinearGradientBrush StartPoint="240.07379,-393.4072" EndPoint="245.82706,-388.55029" MappingMode="Absolute" SpreadMethod="Pad">
<LinearGradientBrush.GradientStops>
<GradientStop Color="#FFFFFFFF" Offset="0" />
<GradientStop Color="#00FFFFFF" Offset="1" />
</LinearGradientBrush.GradientStops>
</LinearGradientBrush>
</Path.Fill>
<Path.RenderTransform>
<MatrixTransform Matrix="0.882629990577698,0,0,0.882629990577698,96.180778503418,108.109100341797" />
</Path.RenderTransform>
</Path>
</Canvas>
<Canvas>
<Path Data="F1M257.25429,-385.7879A6.0325046,6.0325046,0,1,1,245.18928,-385.7879A6.0325046,6.0325046,0,1,1,257.25429,-385.7879z" Fill="#FF888A85" Stroke="{x:Null}" StrokeThickness="1">
<Path.RenderTransform>
<MatrixTransform Matrix="0.911728024482727,0,0,0.911728024482727,90.4540710449219,120.233596801758" />
</Path.RenderTransform>
</Path>
<Path Data="F1M257.25429,-385.7879A6.0325046,6.0325046,0,1,1,245.18928,-385.7879A6.0325046,6.0325046,0,1,1,257.25429,-385.7879z" Stroke="{x:Null}" StrokeThickness="1" Opacity="0.4944444">
<Path.Fill>
<LinearGradientBrush StartPoint="246.74042,-391.31381" EndPoint="252.69785,-385.35165" MappingMode="Absolute" SpreadMethod="Pad">
<LinearGradientBrush.GradientStops>
<GradientStop Color="#FFFFFFFF" Offset="0" />
<GradientStop Color="#00FFFFFF" Offset="1" />
</LinearGradientBrush.GradientStops>
</LinearGradientBrush>
</Path.Fill>
<Path.RenderTransform>
<MatrixTransform Matrix="0.911728024482727,0,0,0.911728024482727,90.4540710449219,120.233596801758" />
</Path.RenderTransform>
</Path>
</Canvas>
<Canvas>
<Path Data="F1M237.80885,-387.88715A4.3752232,4.3752232,0,1,1,229.0584,-387.88715A4.3752232,4.3752232,0,1,1,237.80885,-387.88715z" Fill="#FF888A85" Stroke="{x:Null}" StrokeThickness="1">
<Path.RenderTransform>
<MatrixTransform Matrix="1.14279901981354,0,0,1.14279901981354,35.2322883605957,210.276992797852" />
</Path.RenderTransform>
</Path>
<Path Data="F1M237.80885,-387.88715A4.3752232,4.3752232,0,1,1,229.0584,-387.88715A4.3752232,4.3752232,0,1,1,237.80885,-387.88715z" Stroke="{x:Null}" StrokeThickness="1" Opacity="0.4944444">
<Path.Fill>
<LinearGradientBrush StartPoint="230.87598,-390.43951" EndPoint="235.25652,-386.95901" MappingMode="Absolute" SpreadMethod="Pad">
<LinearGradientBrush.GradientStops>
<GradientStop Color="#FFFFFFFF" Offset="0" />
<GradientStop Color="#00FFFFFF" Offset="1" />
</LinearGradientBrush.GradientStops>
</LinearGradientBrush>
</Path.Fill>
<Path.RenderTransform>
<MatrixTransform Matrix="1.14279901981354,0,0,1.14279901981354,35.2322883605957,210.276992797852" />
</Path.RenderTransform>
</Path>
</Canvas>
<Canvas>
<Path Data="F1M248.54804,-383.6666A6.7396116,6.7396116,0,1,1,235.06881,-383.6666A6.7396116,6.7396116,0,1,1,248.54804,-383.6666z" Fill="#FF888A85" Stroke="{x:Null}" StrokeThickness="1">
<Path.RenderTransform>
<MatrixTransform Matrix="1.03863596916199,0,0,1.03863596916199,59.8490600585938,169.489898681641" />
</Path.RenderTransform>
</Path>
<Path Data="F1M248.54804,-383.6666A6.7396116,6.7396116,0,1,1,235.06881,-383.6666A6.7396116,6.7396116,0,1,1,248.54804,-383.6666z" Stroke="{x:Null}" StrokeThickness="1" Opacity="0.4944444">
<Path.Fill>
<LinearGradientBrush StartPoint="238.00478,-388.47476" EndPoint="245.65462,-382.64539" MappingMode="Absolute" SpreadMethod="Pad">
<LinearGradientBrush.GradientStops>
<GradientStop Color="#FFFFFFFF" Offset="0" />
<GradientStop Color="#00FFFFFF" Offset="1" />
</LinearGradientBrush.GradientStops>
</LinearGradientBrush>
</Path.Fill>
<Path.RenderTransform>
<MatrixTransform Matrix="1.03863596916199,0,0,1.03863596916199,59.8490715026855,169.489898681641" />
</Path.RenderTransform>
</Path>
</Canvas>
<Canvas.RenderTransform>
<MatrixTransform Matrix="1,0,0,1,-287.020385742188,244.999496459961" />
</Canvas.RenderTransform>
</Canvas>
<Canvas>
<Path Data="M-173.24571,-327.59122L-176.37021,-323.31202 -172.59078,-323.31202C-172.59078,-323.31202 -175.29396,-318.78622 -180.16632,-310.38562 -178.07014,-318.33294 -177.21353,-321.35581 -177.21353,-321.35581L-182.37682,-321.35581 -178.33401,-327.59122 -173.24571,-327.59122z" Fill="#FFEDD400" StrokeThickness="1.00000059604645" StrokeMiterLimit="4">
<Path.Stroke>
<LinearGradientBrush StartPoint="-177.483800431213,-325.238411006317" EndPoint="-178.608800431213,-312.488411006317" MappingMode="Absolute" SpreadMethod="Pad">
<LinearGradientBrush.GradientStops>
<GradientStop Color="#FFFCAF3E" Offset="0" />
<GradientStop Color="#00FCAF3E" Offset="1" />
</LinearGradientBrush.GradientStops>
</LinearGradientBrush>
</Path.Stroke>
</Path>
<Path Data="M-173.75946,-327.84461L-177.50268,-322.68152 -173.54648,-322.8583C-173.54648,-322.8583 -173.68639,-322.39837 -178.55875,-313.99777 -176.46257,-321.94509 -176.48985,-321.96275 -176.48985,-321.96275L-181.38797,-321.87436 -177.69871,-327.57944 -173.75946,-327.84461z" Stroke="{x:Null}" StrokeThickness="1">
<Path.Fill>
<LinearGradientBrush StartPoint="-176.318170473938,-325.428969080505" EndPoint="-182.031750473938,-321.451489080505" MappingMode="Absolute" SpreadMethod="Pad">
<LinearGradientBrush.GradientStops>
<GradientStop Color="#FFFFFFFF" Offset="0" />
<GradientStop Color="#00FFFFFF" Offset="1" />
</LinearGradientBrush.GradientStops>
</LinearGradientBrush>
</Path.Fill>
</Path>
<Canvas.RenderTransform>
<MatrixTransform Matrix="1,0,0,1,208.856399536133,357.885101318359" />
</Canvas.RenderTransform>
</Canvas>
<Canvas>
<Path Data="F1M246.49993,-238.49993C244.2291,-238.49993 242.39002,-236.94965 241.78118,-234.87493 241.08795,-235.23876 240.33667,-235.49993 239.49993,-235.49993 236.73993,-235.49993 234.49992,-233.25994 234.49993,-230.49993 234.49993,-229.921 234.66245,-229.39223 234.84368,-228.87493 233.47021,-228.10419 232.49993,-226.68593 232.49993,-224.99993 232.49993,-222.51593 234.51593,-220.49992 236.99993,-220.49993 237.17706,-220.49993 255.8228,-220.49993 255.99993,-220.49993 258.48392,-220.49993 260.49993,-222.51593 260.49993,-224.99993 260.49993,-226.68593 259.52965,-228.10419 258.15618,-228.87493 258.33742,-229.39222 258.49993,-229.92101 258.49993,-230.49993 258.49993,-233.25993 256.25993,-235.49992 253.49993,-235.49993 252.66319,-235.49993 251.91191,-235.23876 251.21868,-234.87493 250.60984,-236.94965 248.77076,-238.49993 246.49993,-238.49993z" Fill="#FF888A85" Stroke="#FF555753" StrokeThickness="1" StrokeMiterLimit="2" />
<Path Data="F1M246.49993,-237.99993C244.31021,-237.99993 242.77633,-236.66416 242.10438,-234.15641 241.43592,-234.50003 240.55679,-234.98976 239.74993,-234.98976 237.03342,-234.98976 234.99479,-233.05094 234.9948,-230.44422 234.9948,-229.89745 235.26201,-229.11078 235.43676,-228.62221 234.11233,-227.89426 232.99993,-226.73171 232.99993,-225.24966 232.99993,-222.90361 234.5461,-220.99957 237.33921,-220.99957 237.51002,-220.99957 255.48985,-220.99957 255.66065,-220.99957 258.43166,-220.99957 259.99993,-222.90361 259.99993,-225.24966 259.99993,-226.84203 258.88753,-227.91635 257.5631,-228.6443 257.73786,-229.13286 258.02717,-229.89746 258.02717,-230.44422 258.02717,-233.05093 255.91136,-235.01185 253.24994,-235.01186 252.44307,-235.01186 251.60813,-234.52212 250.93967,-234.1785 250.29082,-236.60004 248.68966,-237.99993 246.49993,-237.99993z" Stroke="{x:Null}" StrokeThickness="1">
<Path.Fill>
<LinearGradientBrush StartPoint="237.021631335449,-234.051713188477" EndPoint="251.028521335449,-224.969803188477" MappingMode="Absolute" SpreadMethod="Pad">
<LinearGradientBrush.GradientStops>
<GradientStop Color="#FFFFFFFF" Offset="0" />
<GradientStop Color="#00FFFFFF" Offset="1" />
</LinearGradientBrush.GradientStops>
</LinearGradientBrush>
</Path.Fill>
</Path>
<Path Data="F1M291.6875,-437.59375A3.3125,3.3125,0,1,1,285.0625,-437.59375A3.3125,3.3125,0,1,1,291.6875,-437.59375z" Fill="#FF888A85" Stroke="{x:Null}" StrokeThickness="1">
<Path.RenderTransform>
<MatrixTransform Matrix="1.05660402774811,0,0,1.05660402774811,-58.1982498168945,228.863403320313" />
</Path.RenderTransform>
</Path>
<Path Data="F1M291.6875,-437.59375A3.3125,3.3125,0,1,1,285.0625,-437.59375A3.3125,3.3125,0,1,1,291.6875,-437.59375z" Stroke="{x:Null}" StrokeThickness="1" Opacity="0.47777775">
<Path.Fill>
<LinearGradientBrush StartPoint="287.5173,-439.75281" EndPoint="289.67633,-436.32199" MappingMode="Absolute" SpreadMethod="Pad">
<LinearGradientBrush.GradientStops>
<GradientStop Color="#FFFFFFFF" Offset="0" />
<GradientStop Color="#00FFFFFF" Offset="1" />
</LinearGradientBrush.GradientStops>
</LinearGradientBrush>
</Path.Fill>
<Path.RenderTransform>
<MatrixTransform Matrix="1.05660402774811,0,0,1.05660402774811,-58.1982498168945,228.863403320313" />
</Path.RenderTransform>
</Path>
<Rectangle Fill="#FF888A85" Stroke="{x:Null}" Width="20" Height="9" Canvas.Left="236.99994" Canvas.Top="-230.99992" />
<Path Data="F1M291.6875,-437.59375A3.3125,3.3125,0,1,1,285.0625,-437.59375A3.3125,3.3125,0,1,1,291.6875,-437.59375z" Fill="#FF888A85" Stroke="{x:Null}" StrokeThickness="1">
<Path.RenderTransform>
<MatrixTransform Matrix="0.905659973621368,0,0,0.905659973621368,-24.1698703765869,171.311401367188" />
</Path.RenderTransform>
</Path>
<Path Data="F1M291.6875,-437.59375A3.3125,3.3125,0,1,1,285.0625,-437.59375A3.3125,3.3125,0,1,1,291.6875,-437.59375z" Fill="#FF888A85" Stroke="{x:Null}" StrokeThickness="1">
<Path.RenderTransform>
<MatrixTransform Matrix="1.05660402774811,0,0,1.05660402774811,-51.1981811523438,231.863296508789" />
</Path.RenderTransform>
</Path>
<Path Data="F1M291.6875,-437.59375A3.3125,3.3125,0,1,1,285.0625,-437.59375A3.3125,3.3125,0,1,1,291.6875,-437.59375z" Stroke="{x:Null}" StrokeThickness="1" Opacity="0.47777775">
<Path.Fill>
<LinearGradientBrush StartPoint="286.51172,-441.29074" EndPoint="289.85379,-436.14453" MappingMode="Absolute" SpreadMethod="Pad">
<LinearGradientBrush.GradientStops>
<GradientStop Color="#FFFFFFFF" Offset="0" />
<GradientStop Color="#00FFFFFF" Offset="1" />
</LinearGradientBrush.GradientStops>
</LinearGradientBrush>
</Path.Fill>
<Path.RenderTransform>
<MatrixTransform Matrix="1.05660402774811,0,0,1.05660402774811,-51.1982498168945,231.863403320313" />
</Path.RenderTransform>
</Path>
<Path Data="F1M291.6875,-437.59375A3.3125,3.3125,0,1,1,285.0625,-437.59375A3.3125,3.3125,0,1,1,291.6875,-437.59375z" Fill="#FF888A85" Stroke="{x:Null}" StrokeThickness="1">
<Path.RenderTransform>
<MatrixTransform Matrix="1.05660402774811,0,0,1.05660402774811,-65.1982498168945,231.863403320313" />
</Path.RenderTransform>
</Path>
<Path Data="F1M291.6875,-437.59375A3.3125,3.3125,0,1,1,285.0625,-437.59375A3.3125,3.3125,0,1,1,291.6875,-437.59375z" Stroke="{x:Null}" StrokeThickness="1" Opacity="0.47777775">
<Path.Fill>
<LinearGradientBrush StartPoint="285.94086,-439.939" EndPoint="289.39124,-436.4429" MappingMode="Absolute" SpreadMethod="Pad">
<LinearGradientBrush.GradientStops>
<GradientStop Color="#FFFFFFFF" Offset="0" />
<GradientStop Color="#00FFFFFF" Offset="1" />
</LinearGradientBrush.GradientStops>
</LinearGradientBrush>
</Path.Fill>
<Path.RenderTransform>
<MatrixTransform Matrix="1.05660402774811,0,0,1.05660402774811,-65.1982498168945,231.863403320313" />
</Path.RenderTransform>
</Path>
<Path Data="F1M245.46868,-233.96868C241.8893,-233.96868 238.99993,-231.04805 238.99993,-227.46868 238.99993,-225.098 240.34936,-223.13089 242.24993,-221.99993L248.71868,-221.99993C250.61925,-223.13089 251.96868,-225.12924 251.96868,-227.49993 251.96868,-231.07931 249.04805,-233.96868 245.46868,-233.96868z" Fill="#FF888A85" Stroke="{x:Null}" StrokeThickness="1" />
<Path Data="F1M245.49993,-233.99993C241.91193,-233.99993 238.99993,-231.08792 238.99993,-227.49993 238.99993,-225.12353 240.34478,-223.13361 242.24993,-221.99993L248.74993,-221.99993C250.65508,-223.13361 251.99993,-225.12353 251.99993,-227.49993 251.99993,-231.08793 249.08793,-233.99992 245.49993,-233.99993z" Stroke="{x:Null}" StrokeThickness="1" Opacity="0.47777775">
<Path.Fill>
<LinearGradientBrush StartPoint="240.941861335449,-230.104903188477" EndPoint="244.975391335449,-224.918223188477" MappingMode="Absolute" SpreadMethod="Pad">
<LinearGradientBrush.GradientStops>
<GradientStop Color="#FFFFFFFF" Offset="0" />
<GradientStop Color="#00FFFFFF" Offset="1" />
</LinearGradientBrush.GradientStops>
</LinearGradientBrush>
</Path.Fill>
</Path>
<Path Data="F1M291.6875,-437.59375A3.3125,3.3125,0,1,1,285.0625,-437.59375A3.3125,3.3125,0,1,1,291.6875,-437.59375z" Stroke="{x:Null}" StrokeThickness="1" Opacity="0.47777775">
<Path.Fill>
<LinearGradientBrush StartPoint="286.66589,-439.48358" EndPoint="289.76562,-436.70703" MappingMode="Absolute" SpreadMethod="Pad">
<LinearGradientBrush.GradientStops>
<GradientStop Color="#FFFFFFFF" Offset="0" />
<GradientStop Color="#00FFFFFF" Offset="1" />
</LinearGradientBrush.GradientStops>
</LinearGradientBrush>
</Path.Fill>
<Path.RenderTransform>
<MatrixTransform Matrix="0.905659973621368,0,0,0.905659973621368,-24.1697692871094,171.311294555664" />
</Path.RenderTransform>
</Path>
<Path Data="M258.95633,-230.33389C258.9548,-227.64933 255.68707,-226.61994 255.68707,-226.61994 255.68707,-226.61994 258.03581,-228.24589 258.02392,-230.32495 258.02392,-230.32495 258.95633,-230.33389 258.95633,-230.33389z" Fill="#FF555753" Stroke="{x:Null}" StrokeThickness="1" />
<Path Data="F1M291.6875,-437.59375A3.3125,3.3125,0,1,1,285.0625,-437.59375A3.3125,3.3125,0,1,1,291.6875,-437.59375z" Fill="#FF888A85" Stroke="{x:Null}" StrokeThickness="1">
<Path.RenderTransform>
<MatrixTransform Matrix="1.2075469493866,0,0,1.2075469493866,-98.2265167236328,302.415405273438" />
</Path.RenderTransform>
</Path>
<Path Data="F1M291.6875,-437.59375A3.3125,3.3125,0,1,1,285.0625,-437.59375A3.3125,3.3125,0,1,1,291.6875,-437.59375z" Stroke="{x:Null}" StrokeThickness="1" Opacity="0.47777775">
<Path.Fill>
<LinearGradientBrush StartPoint="284.80219,-441.23294" EndPoint="288.89954,-436.83109" MappingMode="Absolute" SpreadMethod="Pad">
<LinearGradientBrush.GradientStops>
<GradientStop Color="#FFFFFFFF" Offset="0" />
<GradientStop Color="#00FFFFFF" Offset="1" />
</LinearGradientBrush.GradientStops>
</LinearGradientBrush>
</Path.Fill>
<Path.RenderTransform>
<MatrixTransform Matrix="1.2075469493866,0,0,1.2075469493866,-98.2265167236328,302.415405273438" />
</Path.RenderTransform>
</Path>
<Canvas.RenderTransform>
<MatrixTransform Matrix="1,0,0,1,-215.005996704102,252.999404907227" />
</Canvas.RenderTransform>
</Canvas>
<Canvas>
<Path Data="M-173.24571,-327.59122L-176.37021,-323.31202 -172.59078,-323.31202C-172.59078,-323.31202 -175.29396,-318.78622 -180.16632,-310.38562 -178.07014,-318.33294 -177.21353,-321.35581 -177.21353,-321.35581L-182.37682,-321.35581 -178.33401,-327.59122 -173.24571,-327.59122z" Fill="#FFEDD400" StrokeThickness="1.00000059604645" StrokeMiterLimit="4">
<Path.Stroke>
<LinearGradientBrush StartPoint="-177.483800431213,-325.238411006317" EndPoint="-178.608800431213,-312.488411006317" MappingMode="Absolute" SpreadMethod="Pad">
<LinearGradientBrush.GradientStops>
<GradientStop Color="#FFFCAF3E" Offset="0" />
<GradientStop Color="#00FCAF3E" Offset="1" />
</LinearGradientBrush.GradientStops>
</LinearGradientBrush>
</Path.Stroke>
</Path>
<Path Data="M-173.75946,-327.84461L-177.50268,-322.68152 -173.54648,-322.8583C-173.54648,-322.8583 -173.68639,-322.39837 -178.55875,-313.99777 -176.46257,-321.94509 -176.48985,-321.96275 -176.48985,-321.96275L-181.38797,-321.87436 -177.69871,-327.57944 -173.75946,-327.84461z" Stroke="{x:Null}" StrokeThickness="1">
<Path.Fill>
<LinearGradientBrush StartPoint="-176.318170473938,-325.428969080505" EndPoint="-182.031750473938,-321.451489080505" MappingMode="Absolute" SpreadMethod="Pad">
<LinearGradientBrush.GradientStops>
<GradientStop Color="#FFFFFFFF" Offset="0" />
<GradientStop Color="#00FFFFFF" Offset="1" />
</LinearGradientBrush.GradientStops>
</LinearGradientBrush>
</Path.Fill>
</Path>
<Canvas.RenderTransform>
<MatrixTransform Matrix="1,0,0,1,192.856399536133,354.885101318359" />
</Canvas.RenderTransform>
</Canvas>
<Path Data="F1M31.626355,14.99952C29.626255,14.99952 27.940775,16.07902 27.095785,17.61446 26.500875,17.39255 25.851145,17.26109 25.169835,17.26109 22.339625,17.26109 20.052305,19.37926 20.052305,21.97859 20.052305,22.43234 20.196835,22.83542 20.327445,23.25072 18.945125,24.11599 17.979615,25.50429 17.979615,27.15545 17.979615,29.80828 18.631235,32.1488 23.207195,31.9613 23.252315,31.95945 40.658675,32.05828 40.907605,31.94327 43.992815,32.16922 44.979615,29.49754 44.979615,27.24381 44.979615,25.5433 44.142675,24.19396 42.670345,23.36622 42.718305,23.10766 42.631785,22.81503 42.631785,22.54397 42.631785,19.94465 40.326135,17.82648 37.495915,17.82648 37.102425,17.82648 36.763515,17.9613 36.395375,18.0385 35.656915,16.27038 33.810365,14.99952 31.626355,14.99952z" Stroke="{x:Null}" StrokeThickness="1">
<Path.Fill>
<RadialGradientBrush Center="-229.75,-343.95554" RadiusX="14.50138" RadiusY="14.50138" GradientOrigin="-229.75,-343.95554" MappingMode="Absolute">
<RadialGradientBrush.GradientStops>
<GradientStop Color="#FFFFFFFF" Offset="0" />
<GradientStop Color="#00FFFFFF" Offset="1" />
</RadialGradientBrush.GradientStops>
<RadialGradientBrush.Transform>
<MatrixTransform Matrix="0.930945992469788,6.18570214869246E-16,-2.8427111277146E-16,0.448244005441666,245.364395141602,184.925598144531" />
</RadialGradientBrush.Transform>
</RadialGradientBrush>
</Path.Fill>
</Path>
<Canvas>
<Path Data="F1M246.49993,-238.49993C244.2291,-238.49993 242.39002,-236.94965 241.78118,-234.87493 241.08795,-235.23876 240.33667,-235.49993 239.49993,-235.49993 236.73993,-235.49993 234.49992,-233.25994 234.49993,-230.49993 234.49993,-229.921 234.66245,-229.39223 234.84368,-228.87493 233.47021,-228.10419 232.49993,-226.68593 232.49993,-224.99993 232.49993,-222.51593 234.51593,-220.49992 236.99993,-220.49993 237.17706,-220.49993 255.8228,-220.49993 255.99993,-220.49993 258.48392,-220.49993 260.49993,-222.51593 260.49993,-224.99993 260.49993,-226.68593 259.52965,-228.10419 258.15618,-228.87493 258.33742,-229.39222 258.49993,-229.92101 258.49993,-230.49993 258.49993,-233.25993 256.25993,-235.49992 253.49993,-235.49993 252.66319,-235.49993 251.91191,-235.23876 251.21868,-234.87493 250.60984,-236.94965 248.77076,-238.49993 246.49993,-238.49993z" Fill="#FF888A85" Stroke="#FF555753" StrokeThickness="1" StrokeMiterLimit="2" />
<Path Data="F1M246.49993,-237.99993C244.31021,-237.99993 242.77633,-236.66416 242.10438,-234.15641 241.43592,-234.50003 240.55679,-234.98976 239.74993,-234.98976 237.03342,-234.98976 234.99479,-233.05094 234.9948,-230.44422 234.9948,-229.89745 235.26201,-229.11078 235.43676,-228.62221 234.11233,-227.89426 232.99993,-226.73171 232.99993,-225.24966 232.99993,-222.90361 234.5461,-220.99957 237.33921,-220.99957 237.51002,-220.99957 255.48985,-220.99957 255.66065,-220.99957 258.43166,-220.99957 259.99993,-222.90361 259.99993,-225.24966 259.99993,-226.84203 258.88753,-227.91635 257.5631,-228.6443 257.73786,-229.13286 258.02717,-229.89746 258.02717,-230.44422 258.02717,-233.05093 255.91136,-235.01185 253.24994,-235.01186 252.44307,-235.01186 251.60813,-234.52212 250.93967,-234.1785 250.29082,-236.60004 248.68966,-237.99993 246.49993,-237.99993z" Stroke="{x:Null}" StrokeThickness="1">
<Path.Fill>
<LinearGradientBrush StartPoint="237.021631335449,-234.051713188477" EndPoint="251.028521335449,-224.969803188477" MappingMode="Absolute" SpreadMethod="Pad">
<LinearGradientBrush.GradientStops>
<GradientStop Color="#FFFFFFFF" Offset="0" />
<GradientStop Color="#00FFFFFF" Offset="1" />
</LinearGradientBrush.GradientStops>
</LinearGradientBrush>
</Path.Fill>
</Path>
<Path Data="F1M291.6875,-437.59375A3.3125,3.3125,0,1,1,285.0625,-437.59375A3.3125,3.3125,0,1,1,291.6875,-437.59375z" Fill="#FF888A85" Stroke="{x:Null}" StrokeThickness="1">
<Path.RenderTransform>
<MatrixTransform Matrix="1.05660402774811,0,0,1.05660402774811,-58.1982498168945,228.863403320313" />
</Path.RenderTransform>
</Path>
<Path Data="F1M291.6875,-437.59375A3.3125,3.3125,0,1,1,285.0625,-437.59375A3.3125,3.3125,0,1,1,291.6875,-437.59375z" Stroke="{x:Null}" StrokeThickness="1" Opacity="0.47777775">
<Path.Fill>
<LinearGradientBrush StartPoint="287.5173,-439.75281" EndPoint="289.67633,-436.32199" MappingMode="Absolute" SpreadMethod="Pad">
<LinearGradientBrush.GradientStops>
<GradientStop Color="#FFFFFFFF" Offset="0" />
<GradientStop Color="#00FFFFFF" Offset="1" />
</LinearGradientBrush.GradientStops>
</LinearGradientBrush>
</Path.Fill>
<Path.RenderTransform>
<MatrixTransform Matrix="1.05660402774811,0,0,1.05660402774811,-58.1982498168945,228.863403320313" />
</Path.RenderTransform>
</Path>
<Rectangle Fill="#FF888A85" Stroke="{x:Null}" Width="20" Height="9" Canvas.Left="236.99994" Canvas.Top="-230.99992" />
<Path Data="F1M291.6875,-437.59375A3.3125,3.3125,0,1,1,285.0625,-437.59375A3.3125,3.3125,0,1,1,291.6875,-437.59375z" Fill="#FF888A85" Stroke="{x:Null}" StrokeThickness="1">
<Path.RenderTransform>
<MatrixTransform Matrix="0.905659973621368,0,0,0.905659973621368,-24.1698703765869,171.311401367188" />
</Path.RenderTransform>
</Path>
<Path Data="F1M291.6875,-437.59375A3.3125,3.3125,0,1,1,285.0625,-437.59375A3.3125,3.3125,0,1,1,291.6875,-437.59375z" Fill="#FF888A85" Stroke="{x:Null}" StrokeThickness="1">
<Path.RenderTransform>
<MatrixTransform Matrix="1.05660402774811,0,0,1.05660402774811,-51.1981811523438,231.863296508789" />
</Path.RenderTransform>
</Path>
<Path Data="F1M291.6875,-437.59375A3.3125,3.3125,0,1,1,285.0625,-437.59375A3.3125,3.3125,0,1,1,291.6875,-437.59375z" Stroke="{x:Null}" StrokeThickness="1" Opacity="0.47777775">
<Path.Fill>
<LinearGradientBrush StartPoint="286.51172,-441.29074" EndPoint="289.85379,-436.14453" MappingMode="Absolute" SpreadMethod="Pad">
<LinearGradientBrush.GradientStops>
<GradientStop Color="#FFFFFFFF" Offset="0" />
<GradientStop Color="#00FFFFFF" Offset="1" />
</LinearGradientBrush.GradientStops>
</LinearGradientBrush>
</Path.Fill>
<Path.RenderTransform>
<MatrixTransform Matrix="1.05660402774811,0,0,1.05660402774811,-51.1982498168945,231.863403320313" />
</Path.RenderTransform>
</Path>
<Path Data="F1M291.6875,-437.59375A3.3125,3.3125,0,1,1,285.0625,-437.59375A3.3125,3.3125,0,1,1,291.6875,-437.59375z" Fill="#FF888A85" Stroke="{x:Null}" StrokeThickness="1">
<Path.RenderTransform>
<MatrixTransform Matrix="1.05660402774811,0,0,1.05660402774811,-65.1982498168945,231.863403320313" />
</Path.RenderTransform>
</Path>
<Path Data="F1M291.6875,-437.59375A3.3125,3.3125,0,1,1,285.0625,-437.59375A3.3125,3.3125,0,1,1,291.6875,-437.59375z" Stroke="{x:Null}" StrokeThickness="1" Opacity="0.47777775">
<Path.Fill>
<LinearGradientBrush StartPoint="285.94086,-439.939" EndPoint="289.39124,-436.4429" MappingMode="Absolute" SpreadMethod="Pad">
<LinearGradientBrush.GradientStops>
<GradientStop Color="#FFFFFFFF" Offset="0" />
<GradientStop Color="#00FFFFFF" Offset="1" />
</LinearGradientBrush.GradientStops>
</LinearGradientBrush>
</Path.Fill>
<Path.RenderTransform>
<MatrixTransform Matrix="1.05660402774811,0,0,1.05660402774811,-65.1982498168945,231.863403320313" />
</Path.RenderTransform>
</Path>
<Path Data="F1M245.46868,-233.96868C241.8893,-233.96868 238.99993,-231.04805 238.99993,-227.46868 238.99993,-225.098 240.34936,-223.13089 242.24993,-221.99993L248.71868,-221.99993C250.61925,-223.13089 251.96868,-225.12924 251.96868,-227.49993 251.96868,-231.07931 249.04805,-233.96868 245.46868,-233.96868z" Fill="#FF888A85" Stroke="{x:Null}" StrokeThickness="1" />
<Path Data="F1M245.49993,-233.99993C241.91193,-233.99993 238.99993,-231.08792 238.99993,-227.49993 238.99993,-225.12353 240.34478,-223.13361 242.24993,-221.99993L248.74993,-221.99993C250.65508,-223.13361 251.99993,-225.12353 251.99993,-227.49993 251.99993,-231.08793 249.08793,-233.99992 245.49993,-233.99993z" Stroke="{x:Null}" StrokeThickness="1" Opacity="0.47777775">
<Path.Fill>
<LinearGradientBrush StartPoint="240.941861335449,-230.104903188477" EndPoint="244.975391335449,-224.918223188477" MappingMode="Absolute" SpreadMethod="Pad">
<LinearGradientBrush.GradientStops>
<GradientStop Color="#FFFFFFFF" Offset="0" />
<GradientStop Color="#00FFFFFF" Offset="1" />
</LinearGradientBrush.GradientStops>
</LinearGradientBrush>
</Path.Fill>
</Path>
<Path Data="F1M291.6875,-437.59375A3.3125,3.3125,0,1,1,285.0625,-437.59375A3.3125,3.3125,0,1,1,291.6875,-437.59375z" Stroke="{x:Null}" StrokeThickness="1" Opacity="0.47777775">
<Path.Fill>
<LinearGradientBrush StartPoint="286.66589,-439.48358" EndPoint="289.76562,-436.70703" MappingMode="Absolute" SpreadMethod="Pad">
<LinearGradientBrush.GradientStops>
<GradientStop Color="#FFFFFFFF" Offset="0" />
<GradientStop Color="#00FFFFFF" Offset="1" />
</LinearGradientBrush.GradientStops>
</LinearGradientBrush>
</Path.Fill>
<Path.RenderTransform>
<MatrixTransform Matrix="0.905659973621368,0,0,0.905659973621368,-24.1697692871094,171.311294555664" />
</Path.RenderTransform>
</Path>
<Path Data="M258.95633,-230.33389C258.9548,-227.64933 255.68707,-226.61994 255.68707,-226.61994 255.68707,-226.61994 258.03581,-228.24589 258.02392,-230.32495 258.02392,-230.32495 258.95633,-230.33389 258.95633,-230.33389z" Fill="#FF555753" Stroke="{x:Null}" StrokeThickness="1" />
<Path Data="F1M291.6875,-437.59375A3.3125,3.3125,0,1,1,285.0625,-437.59375A3.3125,3.3125,0,1,1,291.6875,-437.59375z" Fill="#FF888A85" Stroke="{x:Null}" StrokeThickness="1">
<Path.RenderTransform>
<MatrixTransform Matrix="1.2075469493866,0,0,1.2075469493866,-98.2265167236328,302.415405273438" />
</Path.RenderTransform>
</Path>
<Path Data="F1M291.6875,-437.59375A3.3125,3.3125,0,1,1,285.0625,-437.59375A3.3125,3.3125,0,1,1,291.6875,-437.59375z" Stroke="{x:Null}" StrokeThickness="1" Opacity="0.47777775">
<Path.Fill>
<LinearGradientBrush StartPoint="284.80219,-441.23294" EndPoint="288.89954,-436.83109" MappingMode="Absolute" SpreadMethod="Pad">
<LinearGradientBrush.GradientStops>
<GradientStop Color="#FFFFFFFF" Offset="0" />
<GradientStop Color="#00FFFFFF" Offset="1" />
</LinearGradientBrush.GradientStops>
</LinearGradientBrush>
</Path.Fill>
<Path.RenderTransform>
<MatrixTransform Matrix="1.2075469493866,0,0,1.2075469493866,-98.2265167236328,302.415405273438" />
</Path.RenderTransform>
</Path>
<Canvas.RenderTransform>
<MatrixTransform Matrix="1,0,0,1,-230.020294189453,248.9833984375" />
</Canvas.RenderTransform>
</Canvas>
<Path Data="F1M16.188855,11C14.188755,11 12.503275,12.0795 11.658285,13.61494 11.063375,13.39303 10.413645,13.26157 9.7323346,13.26157 6.9021246,13.26157 4.6148046,15.37974 4.6148046,17.97907 4.6148046,18.43282 4.7593346,18.8359 4.8899446,19.2512 3.5076246,20.11647 2.5421146,21.50477 2.5421146,23.15593 2.5421146,25.80876 3.1937346,28.14928 7.7696946,27.96178 7.8148146,27.95993 25.221175,28.05876 25.470105,27.94375 28.555315,28.1697 29.542115,25.49802 29.542115,23.24429 29.542115,21.54378 28.705175,20.19444 27.232845,19.3667 27.280805,19.10814 27.194285,18.81551 27.194285,18.54445 27.194285,15.94513 24.888635,13.82696 22.058415,13.82696 21.664925,13.82696 21.326015,13.96178 20.957875,14.03898 20.219415,12.27086 18.372865,11 16.188855,11z" Stroke="{x:Null}" StrokeThickness="1">
<Path.Fill>
<RadialGradientBrush Center="-229.75,-343.95554" RadiusX="14.50138" RadiusY="14.50138" GradientOrigin="-229.75,-343.95554" MappingMode="Absolute">
<RadialGradientBrush.GradientStops>
<GradientStop Color="#FFFFFFFF" Offset="0" />
<GradientStop Color="#00FFFFFF" Offset="1" />
</RadialGradientBrush.GradientStops>
<RadialGradientBrush.Transform>
<MatrixTransform Matrix="0.930945992469788,6.18570214869246E-16,-2.8427111277146E-16,0.448244005441666,229.926895141602,180.92610168457" />
</RadialGradientBrush.Transform>
</RadialGradientBrush>
</Path.Fill>
</Path>
</Canvas>
</Canvas>
</Canvas>
</ControlTemplate>
</ResourceDictionary>