WPF Chart - Examples
SciChart WPF ships with hundreds of WPF Chart Examples which you can browse, play with, view the source-code and even export each WPF Chart Example to a stand-alone Visual Studio solution. All of this is possible with the new and improved SciChart WPF Examples Suite, which ships as part of the SciChart WPF SDK.
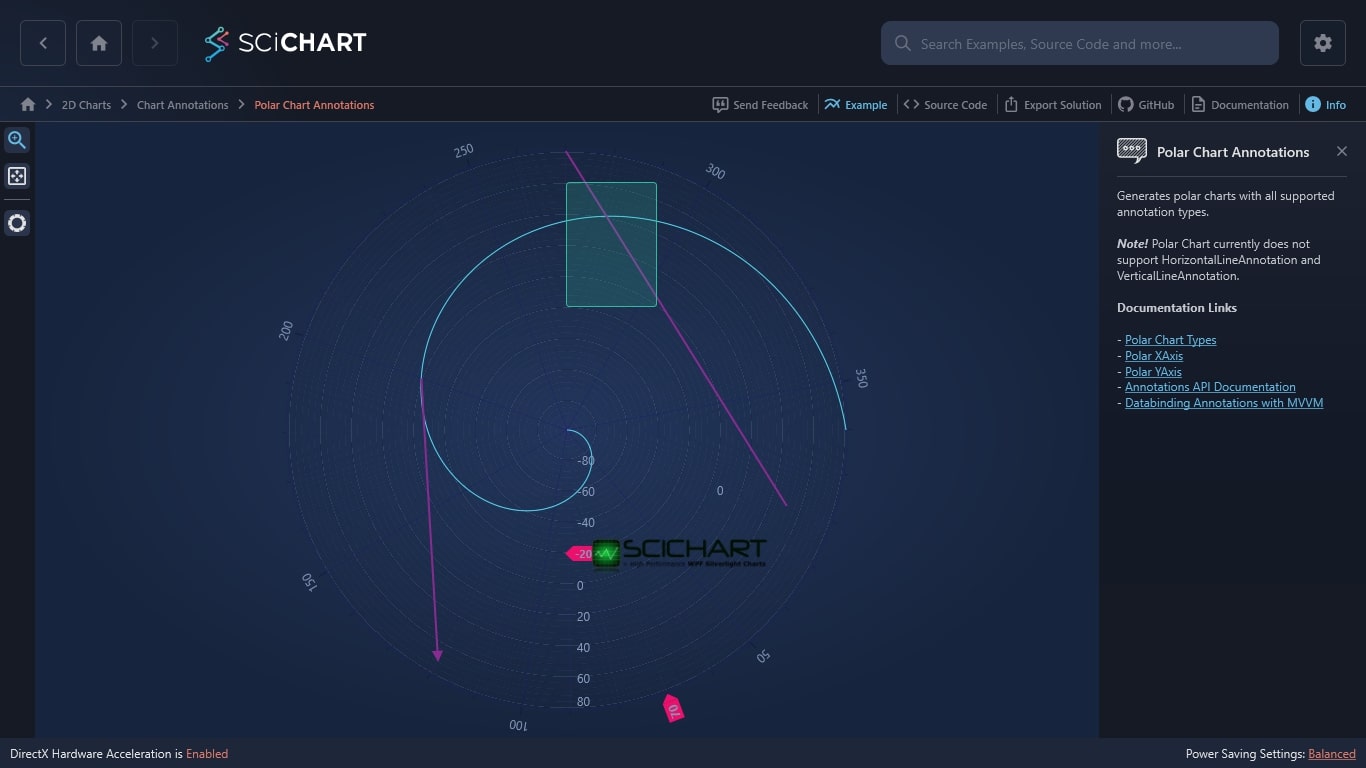
Generates polar charts with all supported annotation types.
Note! Polar Chart currently does not support HorizontalLineAnnotation and VerticalLineAnnotation.
Documentation Links
– Polar Chart Types
– Polar XAxis
– Polar YAxis
– Annotations API Documentation
– Databinding Annotations with MVVM

The C#/WPF source code for the WPF Polar Chart Annotations example is included below (Scroll down!).
Did you know you can also view the source code from one of the following sources as well?
- Clone the SciChart.WPF.Examples from Github.
- Or, view source in the SciChart WPF Examples suite.
- Also the SciChart WPF Trial contains the full source for the examples (link below).
PolarChartAnnotations.xaml
View source code<UserControl x:Class="SciChart.Examples.Examples.AnnotateAChart.PolarChartAnnotations"
xmlns="http://schemas.microsoft.com/winfx/2006/xaml/presentation"
xmlns:x="http://schemas.microsoft.com/winfx/2006/xaml"
xmlns:d="http://schemas.microsoft.com/expression/blend/2008"
xmlns:mc="http://schemas.openxmlformats.org/markup-compatibility/2006"
xmlns:s="http://schemas.abtsoftware.co.uk/scichart"
xmlns:ext="http://schemas.abtsoftware.co.uk/scichart/exampleExternals"
Loaded="PolarChartAnnotations_OnLoaded"
d:DesignHeight="300"
d:DesignWidth="300"
mc:Ignorable="d">
<Grid>
<Grid.ColumnDefinitions>
<ColumnDefinition Width="Auto" />
<ColumnDefinition Width="*" />
</Grid.ColumnDefinitions>
<!-- The SciChartInteractionToolbar adds zoom, pan, zoom extents and rotate functionality -->
<!-- to the chart and is included for example purposes. -->
<!-- If you wish to know how to zoom and pan a chart then do a search for Zoom Pan in the Examples suite! -->
<ext:SciChartInteractionToolbar TargetSurface="{Binding Source={x:Reference Name=sciChart}}" />
<s:SciChartSurface x:Name="sciChart" Grid.Column="1" Padding="0" BorderThickness="0">
<s:SciChartSurface.RenderableSeries>
<s:FastLineRenderableSeries Name="lineSeries1" Stroke="Green" />
</s:SciChartSurface.RenderableSeries>
<s:SciChartSurface.XAxes>
<s:PolarXAxis TextFormatting="0.##" />
</s:SciChartSurface.XAxes>
<s:SciChartSurface.YAxes>
<s:PolarYAxis TextFormatting="0.##" />
</s:SciChartSurface.YAxes>
<s:SciChartSurface.Annotations>
<s:TextAnnotation CanEditText="True"
IsEditable="True"
Text="{Binding Y1,
RelativeSource={RelativeSource Self},
StringFormat=\{0:0.##\}}"
X1="20"
Y1="0" />
<s:CustomAnnotation IsEditable="True"
X1="76"
Y1="-40">
<Image Width="178"
Height="74"
Source="/SciChart.Examples.ExternalDependencies;Component/Resources/Images/SciChartLogo_Dark.png"
Stretch="None" />
</s:CustomAnnotation>
<s:AxisMarkerAnnotation AnnotationCanvas="XAxis"
Background="#FF6600"
IsEditable="True"
X1="70" />
<s:AxisMarkerAnnotation Background="#FF6600"
FontSize="11"
IsEditable="True"
Y1="-20" />
<s:LineAnnotation IsEditable="True"
Stroke="Red"
X1="20"
X2="270"
Y1="50"
Y2="80" />
<s:LineArrowAnnotation IsEditable="True"
Stroke="Red"
StrokeThickness="2"
X1="200"
X2="120"
Y1="0"
Y2="70" />
<s:BoxAnnotation Background="#AC21953A"
BorderBrush="Blue"
BorderThickness="1"
CornerRadius="3"
IsEditable="True"
X1="290"
X2="270"
Y1="70"
Y2="-20" />
</s:SciChartSurface.Annotations>
</s:SciChartSurface>
</Grid>
</UserControl>
PolarChartAnnotations.xaml.cs
View source code// *************************************************************************************
// SCICHART® Copyright SciChart Ltd. 2011-2022. All rights reserved.
//
// Web: http://www.scichart.com
// Support: support@scichart.com
// Sales: sales@scichart.com
//
// PolarChartAnnotations.xaml.cs is part of the SCICHART® Examples. Permission is hereby granted
// to modify, create derivative works, distribute and publish any part of this source
// code whether for commercial, private or personal use.
//
// The SCICHART® examples are distributed in the hope that they will be useful, but
// without any warranty. It is provided "AS IS" without warranty of any kind, either
// expressed or implied.
// *************************************************************************************
using System.Windows;
using System.Windows.Controls;
using SciChart.Charting.Model.DataSeries;
using SciChart.Examples.ExternalDependencies.Data;
namespace SciChart.Examples.Examples.AnnotateAChart
{
/// <summary>
/// Interaction logic for PolarChartAnnotations.xaml
/// </summary>
public partial class PolarChartAnnotations : UserControl
{
public PolarChartAnnotations()
{
InitializeComponent();
}
private void PolarChartAnnotations_OnLoaded(object sender, RoutedEventArgs e)
{
var data = DataManager.Instance.GetStraightLine(0.5, -100, 360);
var dataSeries = new XyDataSeries<double, double>();
dataSeries.Append(data.XData, data.YData);
lineSeries1.DataSeries = dataSeries;
}
}
}
