WPF Chart - Examples
SciChart WPF ships with hundreds of WPF Chart Examples which you can browse, play with, view the source-code and even export each WPF Chart Example to a stand-alone Visual Studio solution. All of this is possible with the new and improved SciChart WPF Examples Suite, which ships as part of the SciChart WPF SDK.
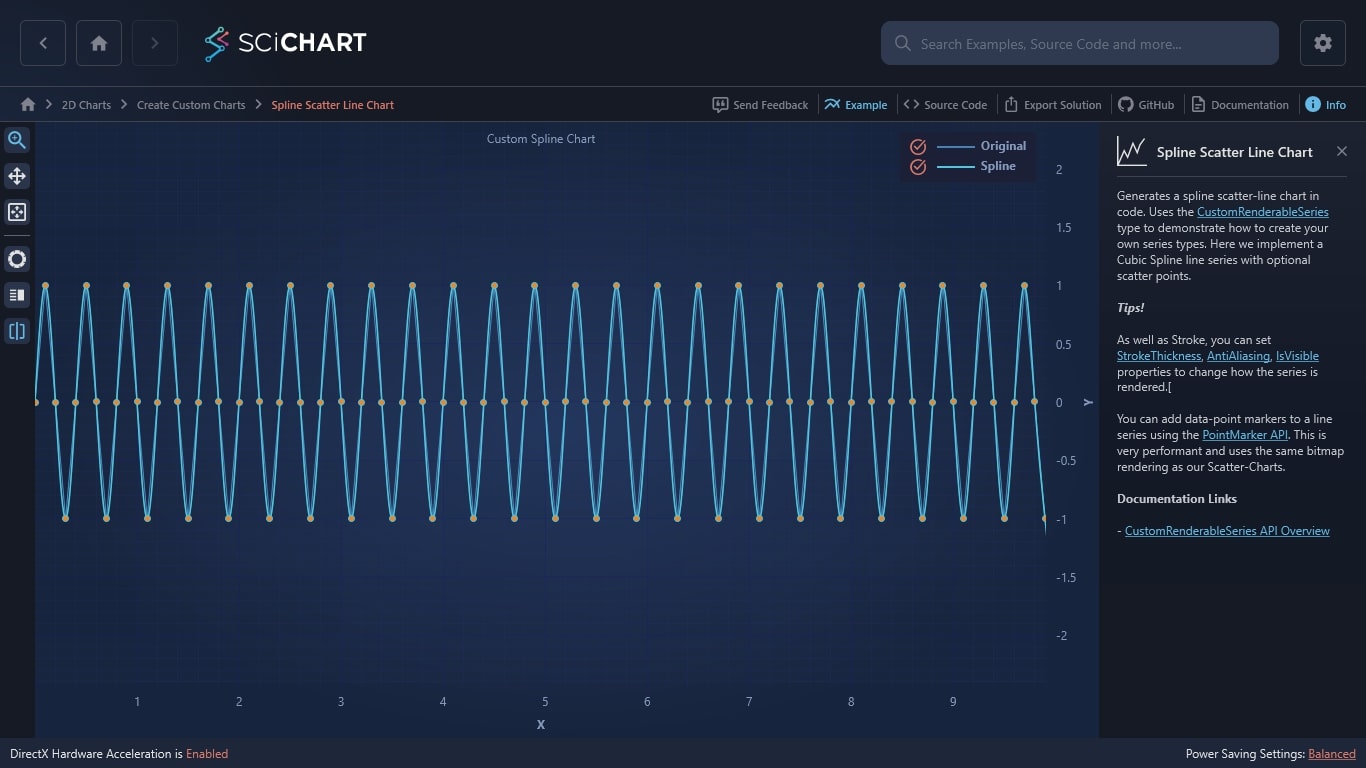
Generates a spline scatter-line chart in code. Uses the CustomRenderableSeries type to demonstrate how to create your own series types. Here we implement a Cubic Spline line series with optional scatter points.
Tips!
As well as Stroke, you can set StrokeThickness, AntiAliasing, IsVisible properties to change how the series is rendered.[
You can add data-point markers to a line series using the PointMarker API. This is very performant and uses the same bitmap rendering as our Scatter-Charts.
Documentation Links

The C#/WPF source code for the WPF Spline Line Scatter Chart example is included below (Scroll down!).
Did you know you can also view the source code from one of the following sources as well?
- Clone the SciChart.WPF.Examples from Github.
- Or, view source in the SciChart WPF Examples suite.
- Also the SciChart WPF Trial contains the full source for the examples (link below).
SplineChartExampleView.xaml
View source code<UserControl x:Class="SciChart.Examples.Examples.CreateACustomChart.SplineLineSeries.SplineChartExampleView"
xmlns="http://schemas.microsoft.com/winfx/2006/xaml/presentation"
xmlns:x="http://schemas.microsoft.com/winfx/2006/xaml"
xmlns:s="http://schemas.abtsoftware.co.uk/scichart"
xmlns:ext="http://schemas.abtsoftware.co.uk/scichart/exampleExternals"
xmlns:local="clr-namespace:SciChart.Examples.Examples.CreateACustomChart.SplineLineSeries"
Loaded="SplineChartExampleView_Loaded"
xmlns:mc="http://schemas.openxmlformats.org/markup-compatibility/2006"
xmlns:d="http://schemas.microsoft.com/expression/blend/2008"
d:DesignHeight="400"
d:DesignWidth="600"
mc:Ignorable="d">
<UserControl.Resources>
<!-- The style for the rollover line -->
<Style x:Key="RolloverLineStyle" TargetType="Line">
<Setter Property="Stroke" Value="DarkGreen"/>
<Setter Property="StrokeThickness" Value="2"/>
<Setter Property="StrokeDashArray" Value="2 2"/>
<Setter Property="IsHitTestVisible" Value="False"/>
<Setter Property="UseLayoutRounding" Value="True"/>
</Style>
</UserControl.Resources>
<Grid>
<Grid.ColumnDefinitions>
<ColumnDefinition Width="Auto" />
<ColumnDefinition Width="*" />
</Grid.ColumnDefinitions>
<!-- The SciChartInteractionToolbar adds zoom, pan, zoom extents and rotate functionality -->
<!-- to the chart and is included for example purposes. -->
<!-- If you wish to know how to zoom and pan a chart then do a search for Zoom Pan in the Examples suite! -->
<ext:SciChartInteractionToolbar TargetSurface="{Binding Source={x:Reference Name=sciChart}}"/>
<!-- Create the chart surface -->
<s:SciChartSurface Name="sciChart" Padding="0" BorderThickness="0" Grid.Column="1">
<s:SciChartSurface.Annotations>
<s:TextAnnotation Text="Custom Spline Chart" HorizontalAnchorPoint="Center" VerticalAnchorPoint="Top" X1="0.5" Y1="0.01" CoordinateMode="Relative"/>
</s:SciChartSurface.Annotations>
<!-- Declare RenderableSeries -->
<s:SciChartSurface.RenderableSeries>
<!-- Draw the original line -->
<s:FastLineRenderableSeries x:Name="LineRenderSeries" Stroke="SteelBlue" StrokeThickness="1" RolloverMarkerTemplate="{x:Null}">
<s:FastLineRenderableSeries.SeriesAnimation>
<s:ScaleAnimation AnimationDelay="0:0:1" Duration="0:0:3"/>
</s:FastLineRenderableSeries.SeriesAnimation>
</s:FastLineRenderableSeries>
<!-- Draw the spline series - custom renderable series -->
<local:SplineLineRenderableSeries x:Name="SplineRenderSeries" Stroke="DarkGreen" StrokeThickness="2"
IsSplineEnabled="True" UpSampleFactor="10">
<local:SplineLineRenderableSeries.SeriesAnimation>
<s:ScaleAnimation AnimationDelay="0:0:1" Duration="0:0:3"/>
</local:SplineLineRenderableSeries.SeriesAnimation>
<!-- LegendMarkerTemplate is required to show a marker in the legend next to SeriesName -->
<local:SplineLineRenderableSeries.LegendMarkerTemplate>
<DataTemplate>
<Line VerticalAlignment="Center" Stretch="Fill" Stroke="DarkGreen"
StrokeThickness="2" X1="0" X2="1" Y1="0.5" Y2="0.5" />
</DataTemplate>
</local:SplineLineRenderableSeries.LegendMarkerTemplate>
<!-- PointMarker is optional, to display a marker on each data point -->
<local:SplineLineRenderableSeries.PointMarker>
<s:EllipsePointMarker Fill="White" Stroke="DarkGreen"/>
</local:SplineLineRenderableSeries.PointMarker>
<!-- RolloverMarker is optional, to display a marker on Rollover -->
<local:SplineLineRenderableSeries.RolloverMarkerTemplate>
<ControlTemplate>
<Ellipse Width="9" Height="9" Fill="White" Stroke="DarkGreen" StrokeThickness="1"></Ellipse>
</ControlTemplate>
</local:SplineLineRenderableSeries.RolloverMarkerTemplate>
</local:SplineLineRenderableSeries>
</s:SciChartSurface.RenderableSeries>
<!-- Create an X Axis with Growby -->
<s:SciChartSurface.XAxis>
<s:NumericAxis AxisTitle="X" TextFormatting="#.############" ScientificNotation="None" DrawMajorBands="True"/>
</s:SciChartSurface.XAxis>
<!-- Create a Y Axis with Growby. Optional bands give a cool look and feel for minimal performance impact -->
<s:SciChartSurface.YAxis>
<s:NumericAxis AxisTitle="Y" GrowBy="0.7, 0.7" DrawMajorBands="True"/>
</s:SciChartSurface.YAxis>
<s:SciChartSurface.ChartModifier>
<s:ModifierGroup>
<s:RubberBandXyZoomModifier x:Name="RubberBandXyZoomModifier" IsEnabled="True"/>
<s:ZoomPanModifier x:Name="ZoomPanModifier" IsEnabled="False" ClipModeX="None"/>
<s:LegendModifier ShowLegend="True" LegendPlacement="Inside" Margin="10" VerticalAlignment="Top" HorizontalAlignment="Right"/>
<s:RolloverModifier x:Name="RolloverModifier" ShowAxisLabels="False"
UseInterpolation="True"
LineOverlayStyle="{StaticResource RolloverLineStyle}"
ShowTooltipOn="Always"/>
<s:XAxisDragModifier/>
<s:YAxisDragModifier/>
<s:ZoomExtentsModifier/>
</s:ModifierGroup>
</s:SciChartSurface.ChartModifier>
</s:SciChartSurface>
</Grid>
</UserControl>
SplineChartExampleView.xaml.cs
View source code// *************************************************************************************
// SCICHART® Copyright SciChart Ltd. 2011-2022. All rights reserved.
//
// Web: http://www.scichart.com
// Support: support@scichart.com
// Sales: sales@scichart.com
//
// SplineChartExampleView.xaml.cs is part of the SCICHART® Examples. Permission is hereby granted
// to modify, create derivative works, distribute and publish any part of this source
// code whether for commercial, private or personal use.
//
// The SCICHART® examples are distributed in the hope that they will be useful, but
// without any warranty. It is provided "AS IS" without warranty of any kind, either
// expressed or implied.
// *************************************************************************************
using System.Windows;
using System.Windows.Controls;
using SciChart.Charting.Model.DataSeries;
using SciChart.Examples.ExternalDependencies.Data;
namespace SciChart.Examples.Examples.CreateACustomChart.SplineLineSeries
{
/// <summary>
/// Interaction logic for CustomChartExampleView.xaml
/// </summary>
public partial class SplineChartExampleView : UserControl
{
public SplineChartExampleView()
{
InitializeComponent();
}
private void SplineChartExampleView_Loaded(object sender, RoutedEventArgs e)
{
// Create a DataSeries of type X=double, Y=double
var originalData = new XyDataSeries<double, double>() {SeriesName = "Original"};
var splineData = new XyDataSeries<double, double>() { SeriesName = "Spline" };
LineRenderSeries.DataSeries = originalData;
SplineRenderSeries.DataSeries = splineData;
var data = DataManager.Instance.GetSinewave(1.0, 0.0, 100, 25);
// Append data to series. SciChart automatically redraws
originalData.Append(data.XData, data.YData);
splineData.Append(data.XData, data.YData);
sciChart.ZoomExtents();
}
}
}
SplineLineRenderableSeries.cs
View source code// *************************************************************************************
// SCICHART® Copyright SciChart Ltd. 2011-2022. All rights reserved.
//
// Web: http://www.scichart.com
// Support: support@scichart.com
// Sales: sales@scichart.com
//
// SplineLineRenderableSeries.cs is part of the SCICHART® Examples. Permission is hereby granted
// to modify, create derivative works, distribute and publish any part of this source
// code whether for commercial, private or personal use.
//
// The SCICHART® examples are distributed in the hope that they will be useful, but
// without any warranty. It is provided "AS IS" without warranty of any kind, either
// expressed or implied.
// *************************************************************************************
using System;
using System.Collections.Generic;
using System.Linq;
using System.Windows;
using SciChart.Charting.Numerics.CoordinateCalculators;
using SciChart.Charting.Visuals.RenderableSeries;
using SciChart.Charting.Visuals.RenderableSeries.DrawingProviders;
using SciChart.Charting.Visuals.RenderableSeries.HitTesters;
using SciChart.Data.Model;
using SciChart.Drawing.Common;
namespace SciChart.Examples.Examples.CreateACustomChart.SplineLineSeries
{
/// <summary>
/// A CustomRenderableSeries example which uses a Cubic Spline algorithm to smooth the points in a FastLineRenderableSeries
/// </summary>
public class SplineLineRenderableSeries : CustomRenderableSeries
{
public static readonly DependencyProperty IsSplineEnabledProperty =
DependencyProperty.Register("IsSplineEnabled", typeof (bool), typeof (SplineLineRenderableSeries),
new PropertyMetadata(default(bool), PropertyChangedCallback));
public bool IsSplineEnabled
{
get { return (bool) GetValue(IsSplineEnabledProperty); }
set { SetValue(IsSplineEnabledProperty, value); }
}
public static readonly DependencyProperty UpSampleFactorProperty = DependencyProperty.Register(
"UpSampleFactor", typeof (int), typeof (SplineLineRenderableSeries), new PropertyMetadata(10, PropertyChangedCallback));
public int UpSampleFactor
{
get { return (int) GetValue(UpSampleFactorProperty); }
set { SetValue(UpSampleFactorProperty, value); }
}
private IList<Point> _splineSeries;
#region HitTest
public class SplineLineHitTestProvider : DefaultHitTestProvider<SplineLineRenderableSeries>
{
public SplineLineHitTestProvider(SplineLineRenderableSeries renderSeries) : base(renderSeries)
{
}
public override HitTestInfo HitTest(Point rawPoint, double hitTestRadius, bool interpolate = false)
{
var nearestBaseHitResult = base.HitTest(rawPoint, hitTestRadius, interpolate);
// No spline? Fine - return base implementation
if (!RenderableSeries.IsSplineEnabled || RenderableSeries._splineSeries == null || RenderableSeries.CurrentRenderPassData == null)
return nearestBaseHitResult;
var nearestHitResult = new HitTestInfo();
// Get the coordinateCalculators. See 'Converting Pixel Coordinates to Data Coordinates' documentation for coordinate transforms
var xCalc = RenderableSeries.CurrentRenderPassData.XCoordinateCalculator;
// Compute the X,Y data value at the mouse location
var xDataPointAtMouse = xCalc.GetDataValue(RenderableSeries.CurrentRenderPassData.IsVerticalChart ? rawPoint.Y : rawPoint.X);
// Find the index in the spline interpolated data that is nearest to the X-Data point at mouse
// NOTE: This assumes the data is sorted in ascending direction and a binary search would be faster ...
int foundIndex = RenderableSeries.FindIndex(RenderableSeries._splineSeries, xDataPointAtMouse);
if (foundIndex != -1)
{
nearestHitResult.IsWithinDataBounds = true;
// Find the nearest data point to the mouse
var xDataPointNearest = RenderableSeries._splineSeries[foundIndex].X;
var yDataPointNearest = RenderableSeries._splineSeries[foundIndex].Y;
nearestHitResult.XValue = xDataPointNearest;
nearestHitResult.YValue = yDataPointNearest;
// Compute the X,Y coordinates (pixel coords) of the nearest data point to the mouse
nearestHitResult.HitTestPoint = nearestHitResult.HitTestPoint = RenderableSeries.GetCoordinatesFor(xDataPointNearest, yDataPointNearest);
// Determine if mouse-location is within 7.07 pixels of the nearest data point
var distance = Math.Pow(rawPoint.X - nearestHitResult.HitTestPoint.X, 2) +
Math.Pow(rawPoint.Y - nearestHitResult.HitTestPoint.Y, 2);
distance = Math.Sqrt(distance);
var baseDistance = Math.Pow(rawPoint.X - nearestBaseHitResult.HitTestPoint.X, 2) +
Math.Pow(rawPoint.Y - nearestBaseHitResult.HitTestPoint.Y, 2);
baseDistance = Math.Sqrt(baseDistance);
nearestHitResult.IsHit = distance <= DefaultHitTestRadius || baseDistance <= DefaultHitTestRadius;
nearestHitResult.IsVerticalHit = true;
nearestHitResult.DataSeriesIndex = nearestBaseHitResult.DataSeriesIndex;
if (RenderableSeries.DataSeries.HasMetadata)
nearestHitResult.Metadata = RenderableSeries.DataSeries.Metadata[nearestHitResult.DataSeriesIndex];
// Returning a HitTestResult with IsHit = true / IsVerticalHit signifies to the Rollovermodifier & TooltipModifier to show a tooltip at this location
return nearestHitResult;
}
else
{
// Returning HitTestInfo.Empty signifies to the RolloverModifier & TooltipModifier there is nothing to show here
return HitTestInfo.Empty;
}
}
}
/// <summary>
/// Gets the <see cref="T:SciChart.Charting.Visuals.RenderableSeries.HitTesters.IHitTestProvider"/> implementation associated with this series. This class provides methods such as <see cref="M:SciChart.Charting.Visuals.RenderableSeries.HitTesters.IHitTestProvider.HitTest(System.Windows.Point,System.Boolean)"/>
/// which return a <see cref="T:SciChart.Charting.Visuals.RenderableSeries.HitTestInfo"/> struct containing information about the Hit-Test operation. Use to determine points near the mouse or whether the mouse is over a series.
/// </summary>
public override IHitTestProvider HitTestProvider { get; protected set; }
#endregion
public SplineLineRenderableSeries()
{
HitTestProvider = new SplineLineHitTestProvider(this);
}
private static void PropertyChangedCallback(DependencyObject d, DependencyPropertyChangedEventArgs e)
{
OnInvalidateParentSurface(d, e);
}
/// <summary>
/// Draws the series using the <see cref="IRenderContext2D" /> and the <see cref="IRenderPassData" /> passed in
/// </summary>
/// <param name="renderContext">The render context. This is a graphics object which has methods to draw lines, quads and polygons to the screen</param>
/// <param name="renderPassData">The render pass data. Contains a resampled
/// <see cref="IPointSeries" />, the
/// <see cref="IndexRange" /> of points on the screen
/// and the current YAxis and XAxis
/// <see cref="ICoordinateCalculator{T}" /> to convert data-points to screen points</param>
protected override void Draw(IRenderContext2D renderContext, IRenderPassData renderPassData)
{
base.Draw(renderContext, renderPassData);
// Get the data from RenderPassData. See CustomRenderableSeries article which describes PointSeries relationship to DataSeries
if (renderPassData.PointSeries.Count == 0) return;
// Convert to Spline Series
_splineSeries = ComputeSplineSeries(renderPassData.PointSeries, IsSplineEnabled, UpSampleFactor);
// Get the coordinates of the first dataPoint
var point = GetCoordinatesFor(_splineSeries[0].X, _splineSeries[0].Y);
// Create a pen to draw the spline line. Make sure you dispose it!
using (var linePen = renderContext.CreatePen(this.Stroke, this.AntiAliasing, this.StrokeThickness))
{
// Create a line drawing context. Make sure you dispose it!
// NOTE: You can create mutliple line drawing contexts to draw segments if you want
// You can also call renderContext.DrawLine() and renderContext.DrawLines(), but the lineDrawingContext is higher performance
using (var lineDrawingContext = renderContext.BeginLine(linePen, point.X, point.Y))
{
for (int i = 1; i < _splineSeries.Count; i++)
{
point = GetCoordinatesFor(_splineSeries[i].X, _splineSeries[i].Y);
lineDrawingContext.MoveTo(point.X, point.Y);
}
}
}
new LegacyPointMarkerRenderer(this, GetPointMarker(), SelectedPointMarker)
.Draw(renderContext, renderPassData.PointSeries, renderPassData);
}
private Point GetCoordinatesFor(double xValue, double yValue)
{
// Get the coordinateCalculators. See 'Converting Pixel Coordinates to Data Coordinates' documentation for coordinate transforms
var xCoord = CurrentRenderPassData.XCoordinateCalculator.GetCoordinate(xValue);
var yCoord = CurrentRenderPassData.YCoordinateCalculator.GetCoordinate(yValue);
if (CurrentRenderPassData.IsVerticalChart)
{
Swap(ref xCoord, ref yCoord);
}
return new Point(xCoord, yCoord);
}
private void Swap(ref double arg1, ref double arg2)
{
var tmp = arg2;
arg2 = arg1;
arg1 = tmp;
}
// Cubic Spline interpolation: http://www.codeproject.com/Articles/560163/Csharp-Cubic-Spline-Interpolation
private IList<Point> ComputeSplineSeries(IPointSeries inputPointSeries, bool isSplineEnabled, int upsampleBy)
{
IList<Point> result = null;
if (!isSplineEnabled)
{
// No spline, just return points. Note: for large datasets, even the copy here causes performance problems!
result = new List<Point>(inputPointSeries.Count);
for (int i = 0; i < inputPointSeries.Count; i++)
{
result.Add(new Point(inputPointSeries.XValues[i], inputPointSeries.YValues[i]));
}
return result;
}
// Spline enabled
int n = inputPointSeries.Count * upsampleBy;
var x = inputPointSeries.XValues.ToArray();
var y = inputPointSeries.YValues.ToArray();
double[] xs = new double[n];
double stepSize = (x[x.Length - 1] - x[0]) / (n - upsampleBy);
for (int i = 0; i < n; i++)
{
xs[i] = x[0] + i * stepSize;
}
var cubicSpline = new CubicSpline();
double[] ys = cubicSpline.FitAndEval(x, y, xs);
result = new List<Point>(n);
for (int i = 0; i < xs.Length; i++)
{
result.Add(new Point(xs[i], ys[i]));
}
return result;
}
private int FindIndex(IList<Point> list, double value)
{
for (int i = 0; i < list.Count; i++)
{
if (list[i].X.CompareTo(value) >= 0)
return i;
}
return -1;
}
}
}
CubicSpline.cs
View source code// *************************************************************************************
// SCICHART® Copyright SciChart Ltd. 2011-2022. All rights reserved.
//
// Web: http://www.scichart.com
// Support: support@scichart.com
// Sales: sales@scichart.com
//
// CubicSpline.cs is part of the SCICHART® Examples. Permission is hereby granted
// to modify, create derivative works, distribute and publish any part of this source
// code whether for commercial, private or personal use.
//
// The SCICHART® examples are distributed in the hope that they will be useful, but
// without any warranty. It is provided "AS IS" without warranty of any kind, either
// expressed or implied.
// *************************************************************************************
using System;
namespace SciChart.Examples.Examples.CreateACustomChart.SplineLineSeries
{
/// <summary>
/// Cubic spline interpolation.
/// Call Fit (or use the corrector constructor) to compute spline coefficients, then Eval to evaluate the spline at other X coordinates.
/// </summary>
/// <remarks>
/// <para>
/// This is implemented based on the wikipedia article:
/// http://en.wikipedia.org/wiki/Spline_interpolation
/// I'm not sure I have the right to include a copy of the article so the equation numbers referenced in
/// comments will end up being wrong at some point.
/// </para>
/// <para>
/// This is not optimized, and is not MT safe.
/// This can extrapolate off the ends of the splines.
/// You must provide points in X sort order.
/// </para>
/// </remarks>
public class CubicSpline
{
#region Fields
// N-1 spline coefficients for N points
private double[] a;
private double[] b;
// Save the original x and y for Eval
private double[] xOrig;
private double[] yOrig;
#endregion
#region Ctor
/// <summary>
/// Default ctor.
/// </summary>
public CubicSpline()
{
}
/// <summary>
/// Construct and call Fit.
/// </summary>
/// <param name="x">Input. X coordinates to fit.</param>
/// <param name="y">Input. Y coordinates to fit.</param>
/// <param name="startSlope">Optional slope constraint for the first point. Single.NaN means no constraint.</param>
/// <param name="endSlope">Optional slope constraint for the final point. Single.NaN means no constraint.</param>
/// <param name="debug">Turn on console output. Default is false.</param>
public CubicSpline(double[] x, double[] y, double startSlope = double.NaN, double endSlope = double.NaN, bool debug = false)
{
Fit(x, y, startSlope, endSlope, debug);
}
#endregion
#region Private Methods
/// <summary>
/// Throws if Fit has not been called.
/// </summary>
private void CheckAlreadyFitted()
{
if (a == null) throw new Exception("Fit must be called before you can evaluate.");
}
private int _lastIndex = 0;
/// <summary>
/// Find where in xOrig the specified x falls, by simultaneous traverse.
/// This allows xs to be less than x[0] and/or greater than x[n-1]. So allows extrapolation.
/// This keeps state, so requires that x be sorted and xs called in ascending order, and is not multi-thread safe.
/// </summary>
private int GetNextXIndex(double x)
{
if (x < xOrig[_lastIndex])
{
throw new ArgumentException("The X values to evaluate must be sorted.");
}
while ((_lastIndex < xOrig.Length - 2) && (x > xOrig[_lastIndex + 1]))
{
_lastIndex++;
}
return _lastIndex;
}
/// <summary>
/// Evaluate the specified x value using the specified spline.
/// </summary>
/// <param name="x">The x value.</param>
/// <param name="j">Which spline to use.</param>
/// <param name="debug">Turn on console output. Default is false.</param>
/// <returns>The y value.</returns>
private double EvalSpline(double x, int j, bool debug = false)
{
double dx = xOrig[j + 1] - xOrig[j];
double t = (x - xOrig[j]) / dx;
double y = (1 - t) * yOrig[j] + t * yOrig[j + 1] + t * (1 - t) * (a[j] * (1 - t) + b[j] * t); // equation 9
if (debug) Console.WriteLine("xs = {0}, j = {1}, t = {2}", x, j, t);
return y;
}
#endregion
#region Fit*
/// <summary>
/// Fit x,y and then eval at points xs and return the corresponding y's.
/// This does the "natural spline" style for ends.
/// This can extrapolate off the ends of the splines.
/// You must provide points in X sort order.
/// </summary>
/// <param name="x">Input. X coordinates to fit.</param>
/// <param name="y">Input. Y coordinates to fit.</param>
/// <param name="xs">Input. X coordinates to evaluate the fitted curve at.</param>
/// <param name="startSlope">Optional slope constraint for the first point. Single.NaN means no constraint.</param>
/// <param name="endSlope">Optional slope constraint for the final point. Single.NaN means no constraint.</param>
/// <param name="debug">Turn on console output. Default is false.</param>
/// <returns>The computed y values for each xs.</returns>
public double[] FitAndEval(double[] x, double[] y, double[] xs, double startSlope = double.NaN, double endSlope = double.NaN, bool debug = false)
{
Fit(x, y, startSlope, endSlope, debug);
return Eval(xs, debug);
}
/// <summary>
/// Compute spline coefficients for the specified x,y points.
/// This does the "natural spline" style for ends.
/// This can extrapolate off the ends of the splines.
/// You must provide points in X sort order.
/// </summary>
/// <param name="x">Input. X coordinates to fit.</param>
/// <param name="y">Input. Y coordinates to fit.</param>
/// <param name="startSlope">Optional slope constraint for the first point. Single.NaN means no constraint.</param>
/// <param name="endSlope">Optional slope constraint for the final point. Single.NaN means no constraint.</param>
/// <param name="debug">Turn on console output. Default is false.</param>
public void Fit(double[] x, double[] y, double startSlope = double.NaN, double endSlope = double.NaN, bool debug = false)
{
if (Double.IsInfinity(startSlope) || Double.IsInfinity(endSlope))
{
throw new Exception("startSlope and endSlope cannot be infinity.");
}
// Save x and y for eval
this.xOrig = x;
this.yOrig = y;
int n = x.Length;
double[] r = new double[n]; // the right hand side numbers: wikipedia page overloads b
TriDiagonalMatrixF m = new TriDiagonalMatrixF(n);
double dx1, dx2, dy1, dy2;
// First row is different (equation 16 from the article)
if (double.IsNaN(startSlope))
{
dx1 = x[1] - x[0];
m.C[0] = 1.0f / dx1;
m.B[0] = 2.0f * m.C[0];
r[0] = 3 * (y[1] - y[0]) / (dx1 * dx1);
}
else
{
m.B[0] = 1;
r[0] = startSlope;
}
// Body rows (equation 15 from the article)
for (int i = 1; i < n - 1; i++)
{
dx1 = x[i] - x[i - 1];
dx2 = x[i + 1] - x[i];
m.A[i] = 1.0f / dx1;
m.C[i] = 1.0f / dx2;
m.B[i] = 2.0f * (m.A[i] + m.C[i]);
dy1 = y[i] - y[i - 1];
dy2 = y[i + 1] - y[i];
r[i] = 3 * (dy1 / (dx1 * dx1) + dy2 / (dx2 * dx2));
}
// Last row also different (equation 17 from the article)
if (double.IsNaN(endSlope))
{
dx1 = x[n - 1] - x[n - 2];
dy1 = y[n - 1] - y[n - 2];
m.A[n - 1] = 1.0f / dx1;
m.B[n - 1] = 2.0f * m.A[n - 1];
r[n - 1] = 3 * (dy1 / (dx1 * dx1));
}
else
{
m.B[n - 1] = 1;
r[n - 1] = endSlope;
}
// if (debug) Console.WriteLine("Tri-diagonal matrix:\n{0}", m.ToDisplayString(":0.0000", " "));
// if (debug) Console.WriteLine("r: {0}", ArrayUtil.ToString<double>(r));
// k is the solution to the matrix
double[] k = m.Solve(r);
// if (debug) Console.WriteLine("k = {0}", ArrayUtil.ToString<double>(k));
// a and b are each spline's coefficients
this.a = new double[n - 1];
this.b = new double[n - 1];
for (int i = 1; i < n; i++)
{
dx1 = x[i] - x[i - 1];
dy1 = y[i] - y[i - 1];
a[i - 1] = k[i - 1] * dx1 - dy1; // equation 10 from the article
b[i - 1] = -k[i] * dx1 + dy1; // equation 11 from the article
}
// if (debug) Console.WriteLine("a: {0}", ArrayUtil.ToString<double>(a));
// if (debug) Console.WriteLine("b: {0}", ArrayUtil.ToString<double>(b));
}
#endregion
#region Eval*
/// <summary>
/// Evaluate the spline at the specified x coordinates.
/// This can extrapolate off the ends of the splines.
/// You must provide X's in ascending order.
/// The spline must already be computed before calling this, meaning you must have already called Fit() or FitAndEval().
/// </summary>
/// <param name="x">Input. X coordinates to evaluate the fitted curve at.</param>
/// <param name="debug">Turn on console output. Default is false.</param>
/// <returns>The computed y values for each x.</returns>
public double[] Eval(double[] x, bool debug = false)
{
CheckAlreadyFitted();
int n = x.Length;
double[] y = new double[n];
_lastIndex = 0; // Reset simultaneous traversal in case there are multiple calls
for (int i = 0; i < n; i++)
{
// Find which spline can be used to compute this x (by simultaneous traverse)
int j = GetNextXIndex(x[i]);
// Evaluate using j'th spline
y[i] = EvalSpline(x[i], j, debug);
}
return y;
}
/// <summary>
/// Evaluate (compute) the slope of the spline at the specified x coordinates.
/// This can extrapolate off the ends of the splines.
/// You must provide X's in ascending order.
/// The spline must already be computed before calling this, meaning you must have already called Fit() or FitAndEval().
/// </summary>
/// <param name="x">Input. X coordinates to evaluate the fitted curve at.</param>
/// <param name="debug">Turn on console output. Default is false.</param>
/// <returns>The computed y values for each x.</returns>
public double[] EvalSlope(double[] x, bool debug = false)
{
CheckAlreadyFitted();
int n = x.Length;
double[] qPrime = new double[n];
_lastIndex = 0; // Reset simultaneous traversal in case there are multiple calls
for (int i = 0; i < n; i++)
{
// Find which spline can be used to compute this x (by simultaneous traverse)
int j = GetNextXIndex(x[i]);
// Evaluate using j'th spline
double dx = xOrig[j + 1] - xOrig[j];
double dy = yOrig[j + 1] - yOrig[j];
double t = (x[i] - xOrig[j]) / dx;
// From equation 5 we could also compute q' (qp) which is the slope at this x
qPrime[i] = dy / dx
+ (1 - 2 * t) * (a[j] * (1 - t) + b[j] * t) / dx
+ t * (1 - t) * (b[j] - a[j]) / dx;
if (debug) Console.WriteLine("[{0}]: xs = {1}, j = {2}, t = {3}", i, x[i], j, t);
}
return qPrime;
}
#endregion
#region Static Methods
/// <summary>
/// Static all-in-one method to fit the splines and evaluate at X coordinates.
/// </summary>
/// <param name="x">Input. X coordinates to fit.</param>
/// <param name="y">Input. Y coordinates to fit.</param>
/// <param name="xs">Input. X coordinates to evaluate the fitted curve at.</param>
/// <param name="startSlope">Optional slope constraint for the first point. Single.NaN means no constraint.</param>
/// <param name="endSlope">Optional slope constraint for the final point. Single.NaN means no constraint.</param>
/// <param name="debug">Turn on console output. Default is false.</param>
/// <returns>The computed y values for each xs.</returns>
public static double[] Compute(double[] x, double[] y, double[] xs, double startSlope = double.NaN, double endSlope = double.NaN, bool debug = false)
{
CubicSpline spline = new CubicSpline();
return spline.FitAndEval(x, y, xs, startSlope, endSlope, debug);
}
/// <summary>
/// Fit the input x,y points using a 'geometric' strategy so that y does not have to be a single-valued
/// function of x.
/// </summary>
/// <param name="x">Input x coordinates.</param>
/// <param name="y">Input y coordinates, do not need to be a single-valued function of x.</param>
/// <param name="nOutputPoints">How many output points to create.</param>
/// <param name="xs">Output (interpolated) x values.</param>
/// <param name="ys">Output (interpolated) y values.</param>
public static void FitGeometric(double[] x, double[] y, int nOutputPoints, out double[] xs, out double[] ys)
{
// Compute distances
int n = x.Length;
double[] dists = new double[n]; // cumulative distance
dists[0] = 0;
double totalDist = 0;
for (int i = 1; i < n; i++)
{
double dx = x[i] - x[i - 1];
double dy = y[i] - y[i - 1];
double dist = (double)Math.Sqrt(dx * dx + dy * dy);
totalDist += dist;
dists[i] = totalDist;
}
// Create 'times' to interpolate to
double dt = totalDist / (nOutputPoints - 1);
double[] times = new double[nOutputPoints];
times[0] = 0;
for (int i = 1; i < nOutputPoints; i++)
{
times[i] = times[i - 1] + dt;
}
// Spline fit both x and y to times
CubicSpline xSpline = new CubicSpline();
xs = xSpline.FitAndEval(dists, x, times);
CubicSpline ySpline = new CubicSpline();
ys = ySpline.FitAndEval(dists, y, times);
}
#endregion
}
}
TriDiagonalMatrix.cs
View source code// *************************************************************************************
// SCICHART® Copyright SciChart Ltd. 2011-2022. All rights reserved.
//
// Web: http://www.scichart.com
// Support: support@scichart.com
// Sales: sales@scichart.com
//
// TriDiagonalMatrix.cs is part of the SCICHART® Examples. Permission is hereby granted
// to modify, create derivative works, distribute and publish any part of this source
// code whether for commercial, private or personal use.
//
// The SCICHART® examples are distributed in the hope that they will be useful, but
// without any warranty. It is provided "AS IS" without warranty of any kind, either
// expressed or implied.
// *************************************************************************************
using System;
using System.Diagnostics;
using System.Text;
namespace SciChart.Examples.Examples.CreateACustomChart.SplineLineSeries
{
/// <summary>
/// A tri-diagonal matrix has non-zero entries only on the main diagonal, the diagonal above the main (super), and the
/// diagonal below the main (sub).
/// </summary>
/// <remarks>
/// <para>
/// This is based on the wikipedia article: http://en.wikipedia.org/wiki/Tridiagonal_matrix_algorithm
/// </para>
/// <para>
/// The entries in the matrix on a particular row are A[i], B[i], and C[i] where i is the row index.
/// B is the main diagonal, and so for an NxN matrix B is length N and all elements are used.
/// So for row 0, the first two values are B[0] and C[0].
/// And for row N-1, the last two values are A[N-1] and B[N-1].
/// That means that A[0] is not actually on the matrix and is therefore never used, and same with C[N-1].
/// </para>
/// </remarks>
public class TriDiagonalMatrixF
{
/// <summary>
/// The values for the sub-diagonal. A[0] is never used.
/// </summary>
public double[] A;
/// <summary>
/// The values for the main diagonal.
/// </summary>
public double[] B;
/// <summary>
/// The values for the super-diagonal. C[C.Length-1] is never used.
/// </summary>
public double[] C;
/// <summary>
/// The width and height of this matrix.
/// </summary>
public int N
{
get { return (A != null ? A.Length : 0); }
}
/// <summary>
/// Indexer. Setter throws an exception if you try to set any not on the super, main, or sub diagonals.
/// </summary>
public double this[int row, int col]
{
get
{
int di = row - col;
if (di == 0)
{
return B[row];
}
else if (di == -1)
{
Debug.Assert(row < N - 1);
return C[row];
}
else if (di == 1)
{
Debug.Assert(row > 0);
return A[row];
}
else return 0;
}
set
{
int di = row - col;
if (di == 0)
{
B[row] = value;
}
else if (di == -1)
{
Debug.Assert(row < N - 1);
C[row] = value;
}
else if (di == 1)
{
Debug.Assert(row > 0);
A[row] = value;
}
else
{
throw new ArgumentException("Only the main, super, and sub diagonals can be set.");
}
}
}
/// <summary>
/// Construct an NxN matrix.
/// </summary>
public TriDiagonalMatrixF(int n)
{
this.A = new double[n];
this.B = new double[n];
this.C = new double[n];
}
/// <summary>
/// Produce a string representation of the contents of this matrix.
/// </summary>
/// <param name="fmt">Optional. For String.Format. Must include the colon. Examples are ':0.000' and ',5:0.00' </param>
/// <param name="prefix">Optional. Per-line indentation prefix.</param>
public string ToDisplayString(string fmt = "", string prefix = "")
{
if (this.N > 0)
{
var s = new StringBuilder();
string formatString = "{0" + fmt + "}";
for (int r = 0; r < N; r++)
{
s.Append(prefix);
for (int c = 0; c < N; c++)
{
s.AppendFormat(formatString, this[r, c]);
if (c < N - 1) s.Append(", ");
}
s.AppendLine();
}
return s.ToString();
}
else
{
return prefix + "0x0 Matrix";
}
}
/// <summary>
/// Solve the system of equations this*x=d given the specified d.
/// </summary>
/// <remarks>
/// Uses the Thomas algorithm described in the wikipedia article: http://en.wikipedia.org/wiki/Tridiagonal_matrix_algorithm
/// Not optimized. Not destructive.
/// </remarks>
/// <param name="d">Right side of the equation.</param>
public double[] Solve(double[] d)
{
int n = this.N;
if (d.Length != n)
{
throw new ArgumentException("The input d is not the same size as this matrix.");
}
// cPrime
double[] cPrime = new double[n];
cPrime[0] = C[0] / B[0];
for (int i = 1; i < n; i++)
{
cPrime[i] = C[i] / (B[i] - cPrime[i - 1] * A[i]);
}
// dPrime
double[] dPrime = new double[n];
dPrime[0] = d[0] / B[0];
for (int i = 1; i < n; i++)
{
dPrime[i] = (d[i] - dPrime[i - 1] * A[i]) / (B[i] - cPrime[i - 1] * A[i]);
}
// Back substitution
double[] x = new double[n];
x[n - 1] = dPrime[n - 1];
for (int i = n - 2; i >= 0; i--)
{
x[i] = dPrime[i] - cPrime[i] * x[i + 1];
}
return x;
}
}
}
