
Creating your Own Series
If the built-in chart types in SciChart are not enough, you can create your own RenderableSeries by using the CustomRenderableSeries API! CustomRenderableSeries inherits BaseRenderableSeries. It simply has one method which you must override - Draw().
Examples for the Custom Renderable Series can be found in the SciChart WPF Examples Suite which can be downloaded from the SciChart Website or our SciChart.WPF.Examples Github Repository.
| Custom Series (CustomRenderableSeries) |
Copy Code |
|---|---|
/// <summary> /// Defines a Custom Renderable Series - override Draw() to /// define what is drawn to the screen at render time /// </summary> public class CustomRenderableSeries : BaseRenderableSeries { /// <summary> /// Draws the series using the <see cref="IRenderContext2D"/> /// and the <see cref="IRenderPassData"/> passed in /// </summary> /// <param name="renderContext">The render context. This is a graphics object which has /// methods to draw lines, quads and polygons to the screen</param> /// <param name="renderPassData">The render pass data. Contains a resampled /// <see cref="IPointSeries"/>, the <see cref="IndexRange"/> of points on the screen /// and the current YAxis and XAxis <see cref="ICoordinateCalculator{T}"/> /// to convert data-points to screen points</param> protected virtual void Draw(IRenderContext2D renderContext, IRenderPassData renderPassData) { base.Draw(renderContext, renderPassData); // TODO: Some drawing! } } | |
IRenderContext2D – the Immediate Mode Graphics Object
The IRenderContext passed in to the Draw() method is the graphics context for this render pass. Use this to draw to the screen.
Note: For a full walk-through of the RenderContext API, see the section on Immediate Mode RenderContext API.
IRenderPassData – the current Data to Draw
The data to draw is contained in the IRenderPassData passed in to the Draw method. The interface can be seen below:
| IRenderPassData – the current Data to Draw |
Copy Code |
|---|---|
/// <summary> /// Defines the interface to <see cref="RenderPassData"/>, the data used in a single render pass by <see cref="BaseRenderableSeries"/> derived types /// </summary> public interface IRenderPassData { /// <summary> /// Gets the integer indices of the X-Data array that are currently in range. /// </summary> /// <returns>The indices to the X-Data that are currently in range</returns> /// <example>If the input X-data is 0...100 in steps of 1, the VisibleRange is 10, 30 then the PointRange will be 10, 30</example> /// <remarks></remarks> IndexRange PointRange { get; } /// <summary> /// Gets the current point series. /// </summary> IPointSeries PointSeries { get; } /// <summary> /// Gets a value, indicating whether current chart is vertical /// </summary> bool IsVerticalChart { get; } /// <summary> /// Gets the current Y coordinate calculator. /// </summary> ICoordinateCalculator<double> YCoordinateCalculator { get; } /// <summary> /// Gets the current X coordinate calculator. /// </summary> ICoordinateCalculator<double> XCoordinateCalculator { get; } /// <summary> /// Gets the current pixel transformation strategy /// </summary> ITransformationStrategy TransformationStrategy { get; } } | |
Using the IRenderPassData you can access the PointSeries (the data to draw), the PointRange (the indices of the data to draw, inclusive, the X and YCoordinateCalculator (which transforms data to pixel coordinates).
IPointSeries Derived Types
The IPointSeries interface is passed in to CustomRenderableSeries.Draw() via the IRenderPassData interface. Depending on the DataSeries type you can have a different PointSeries type and different ways to access the data.
| DataSeries Type | PointSeries Type |
| XyDataSeries | Point2DSeries |
| XyyDataSeries | XyyPointSeries |
| XyzDataSeries | XyzPointSeries |
| HlcDataSeries | HlcPointSeries |
| OhlcDataSeries | OhlcPointSeries |
| BoxPlotDataSeries | OhlcPointSeries |
An example of how to get data out of a PointSeries is included below:
PointSeries2D
| IRenderPassData – the current Data to Draw |
Copy Code |
|---|---|
public class CustomRenderableSeriesSample : CustomRenderableSeries { protected override void Draw(IRenderContext2D renderContext, IRenderPassData renderPassData) { base.Draw(renderContext, renderPassData); // The resampled data for this render pass var dataPointSeries = renderPassData.PointSeries as Point2DSeries; if (dataPointSeries == null) return; var xCalc = renderPassData.XCoordinateCalculator; var yCalc = renderPassData.YCoordinateCalculator; // Iterate over the point series for (int i = 0; i < dataPointSeries.Count; i++) { // Get the X,Y value var x = dataPointSeries.XValues[i]; var y = dataPointSeries.YValues[i]; // If you want it, the original data-point index var index = dataPointSeries.Indexes[i]; // Transform to coordinate var xCoord = xCalc.GetCoordinate(x); var yCoord = yCalc.GetCoordinate(y); // TODO: Do some drawing with renderContext } } } | |
XyyPointSeries
| XyyPointSeries |
Copy Code |
|---|---|
public class CustomRenderableSeriesSample : CustomRenderableSeries { protected override void Draw(IRenderContext2D renderContext, IRenderPassData renderPassData) { base.Draw(renderContext, renderPassData); // The resampled data for this render pass var dataPointSeries = renderPassData.PointSeries as XyyPoint2DSeries; if (dataPointSeries == null) return; var xCalc = renderPassData.XCoordinateCalculator; var yCalc = renderPassData.XCoordinateCalculator; // Iterate over the point series for (int i = 0; i < dataPointSeries.Count; i++) { // Get the X,Y1,Y2 values var x = dataPointSeries.XValues[i]; var y0 = dataPointSeries.YValues[i]; var y1 = dataPointSeries.Y1Values[i]; // Transform to coordinate var xCoord = xCalc.GetCoordinate(x); var y0Coord = yCalc.GetCoordinate(y0); var y1Coord = yCalc.GetCoordinate(y1); // TODO: Do some drawing with renderContext } } } | |
XyzPointSeries
| XyzPointSeries |
Copy Code |
|---|---|
public class CustomRenderableSeriesSample : CustomRenderableSeries { protected override void Draw(IRenderContext2D renderContext, IRenderPassData renderPassData) { base.Draw(renderContext, renderPassData); // The resampled data for this render pass var dataPointSeries = renderPassData.PointSeries as XyzPointSeries; if (dataPointSeries == null) return; var xCalc = renderPassData.XCoordinateCalculator; var yCalc = renderPassData.XCoordinateCalculator; // Iterate over the point series for (int i = 0; i < dataPointSeries.Count; i++) { // Get the X,Y,Z values var x = dataPointSeries.XValues[i]; var y = dataPointSeries.YValues[i]; var z = dataPointSeries.ZPoints[i]; // Transform to coordinate var xCoord = xCalc.GetCoordinate(x); var yCoord = yCalc.GetCoordinate(y); // TODO: Do some drawing with renderContext } } } | |
OhlcPointSeries
| OhlcPointSeries |
Copy Code |
|---|---|
public class CustomRenderableSeriesSample : CustomRenderableSeries { protected override void Draw(IRenderContext2D renderContext, IRenderPassData renderPassData) { base.Draw(renderContext, renderPassData); // The resampled data for this render pass var dataPointSeries = renderPassData.PointSeries as OhlcPointSeries; if (dataPointSeries == null) return; var xCalc = renderPassData.XCoordinateCalculator; var yCalc = renderPassData.YCoordinateCalculator; // Iterate over the point series for (int i = 0; i < dataPointSeries.Count; i++) { // Get the Open, High, Low, Close, X values var x = dataPointSeries.XValues[i]; var open = dataPointSeries.OpenValues[i]; var high = dataPointSeries.HighValues[i]; var low = dataPointSeries.LowValues[i]; var close = dataPointSeries.HighValues[i]; // Transform to coordinate var xCoord = xCalc.GetCoordinate(x); var openCoord = yCalc.GetCoordinate(open); var highCoord = yCalc.GetCoordinate(high); var lowCoord = yCalc.GetCoordinate(low); var closeCoord = yCalc.GetCoordinate(close); // TODO: Do some drawing with renderContext } } } | |
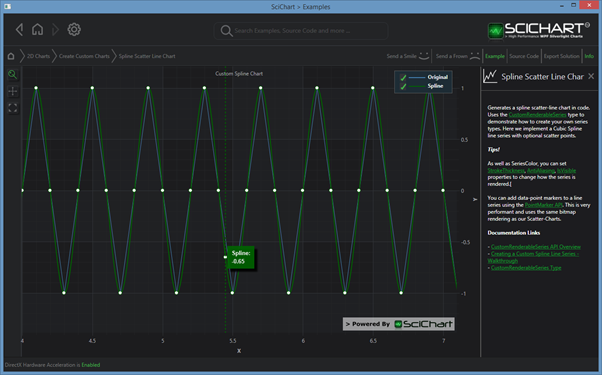
Worked Example: SplineLineRenderableSeries
We have a full worked example over at https://support.scichart.com/index.php?/Knowledgebase/Article/View/17254/41/creating-a-custom-spline-line-series which shows how to create a spline series with this powerful API.
Worked Example: CustomLineRenderableSeries
A worked example is found below for a CustomRenderableSeries which draws a Polyline using the RenderContext API. This is no different from our Line series, but shows some of the internals of how this API works
| CustomLineRenderableSeries |
Copy Code |
|---|---|
public class CustomLinesRenderableSeries : CustomRenderableSeries { protected override void Draw(IRenderContext2D renderContext, IRenderPassData renderPassData) { base.Draw(renderContext, renderPassData); // The resampled data for this render pass var dataPointSeries = renderPassData.PointSeries; if (dataPointSeries.Count == 0) return; var xCalc = renderPassData.XCoordinateCalculator; var yCalc = renderPassData.YCoordinateCalculator; double xCoord0 = xCalc.GetCoordinate(dataPointSeries.XValues[0]); double yCoord0 = yCalc.GetCoordinate(dataPointSeries.YValues[0]); // Begin a batched Polyline draw operation using (var pen = renderContext.CreatePen(Colors.Red, true, 1.0f)) using (var lineContext = renderContext.BeginLine(pen, xCoord0, yCoord0)) { // Iterate over the data for (int i = 1; i < dataPointSeries.Count; i++) { // Convert data to coords double xCoord = xCalc.GetCoordinate(dataPointSeries.XValues[i]); double yCoord = yCalc.GetCoordinate(dataPointSeries.YValues[i]); // Draw at current location lineContext.MoveTo(xCoord, yCoord); } }// When lineContext is disposed, the line draws // Notes: to change pen color, restart a new BeginLine() context } } | |
Worked Example: CustomPointRenderableSeries
A worked example is found below for a CustomRenderableSeries which draws a PointMarker using the RenderContext API. This is no different from our Scatter series, but shows some of the internals of how this API works
| CustomPointRenderableSeries |
Copy Code |
|---|---|
public class CustomPointRenderableSeries : CustomRenderableSeries { protected override void Draw(IRenderContext2D renderContext, IRenderPassData renderPassData) { base.Draw(renderContext, renderPassData); // Get the CustomPointRenderableSeries.PointMarker to draw at original points // Assumes you have declared one in XAML or code // // e.g. CustomPointRenderableSeries.PointMarker = new EllipsePointMarker(); // var pointMarker = base.GetPointMarker(); if (pointMarker != null) { // The resampled data for this render pass var dataPointSeries = renderPassData.PointSeries; var xCalc = renderPassData.XCoordinateCalculator; var yCalc = renderPassData.YCoordinateCalculator; // Begin a batched PointMarker draw operation pointMarker.BeginBatch(renderContext, pointMarker.Stroke, pointMarker.Fill); // Iterate over the data for (int i = 0; i < dataPointSeries.Count; i++) { // Convert data to coords double xCoord = xCalc.GetCoordinate(dataPointSeries.XValues[i]); double yCoord = yCalc.GetCoordinate(dataPointSeries.YValues[i]); int dataIndex = dataPointSeries.Indexes[i]; // Draw at current location pointMarker.MoveTo(renderContext, xCoord, yCoord, dataIndex); } // End the batch // Note: To change point color, start a new batch pointMarker.EndBatch(renderContext); } } } | |