WPF Chart - Examples
SciChart WPF ships with hundreds of WPF Chart Examples which you can browse, play with, view the source-code and even export each WPF Chart Example to a stand-alone Visual Studio solution. All of this is possible with the new and improved SciChart WPF Examples Suite, which ships as part of the SciChart WPF SDK.
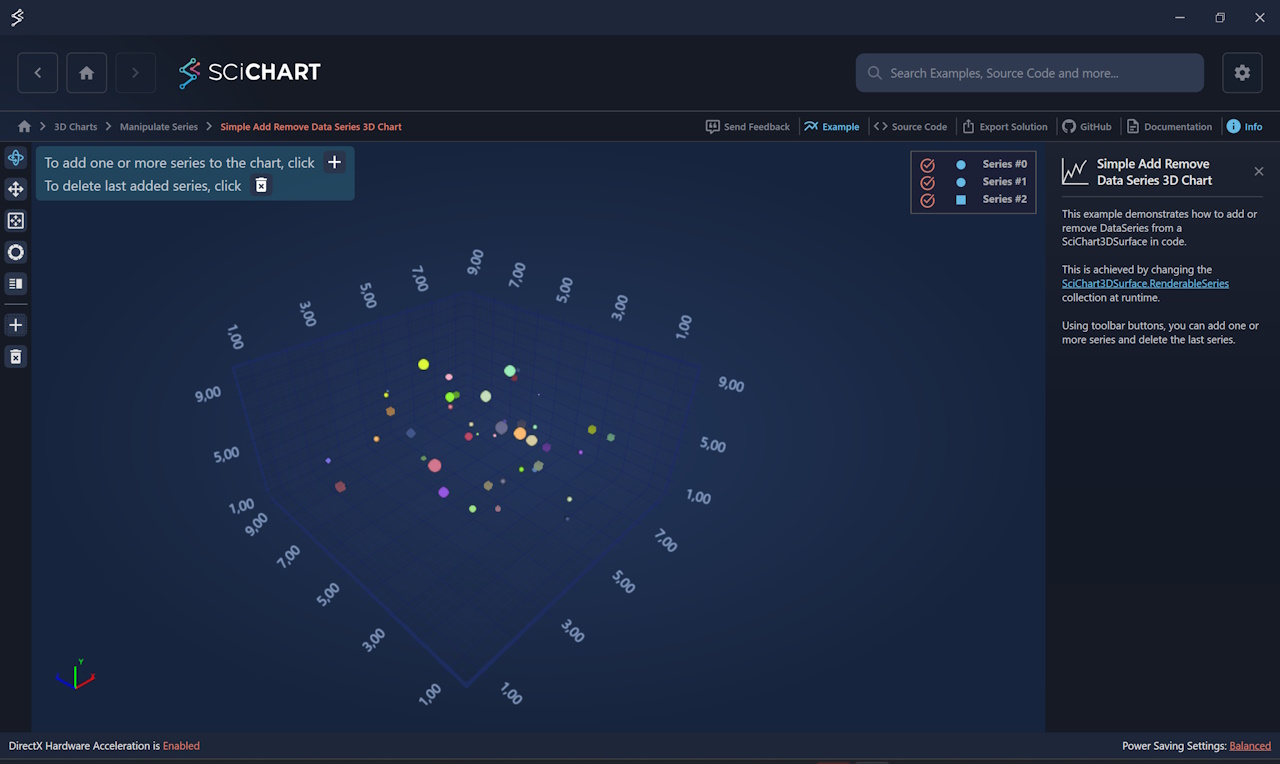
This example demonstrates how to add or remove DataSeries from a SciChart3DSurface in code.
This is achieved by changing the SciChart3DSurface.RenderableSeries collection at runtime.
Click ‘ADD’ several times to add series. Now click ‘DEL’ to remove the last series.

The C#/WPF source code for the WPF 3D Chart Add Remove Data Series Example example is included below (Scroll down!).
Did you know you can also view the source code from one of the following sources as well?
- Clone the SciChart.WPF.Examples from Github.
- Or, view source in the SciChart WPF Examples suite.
- Also the SciChart WPF Trial contains the full source for the examples (link below).
AddRemoveDataSeries3DChart.xaml
View source code<UserControl x:Class="SciChart.Examples.Examples.Charts3D.ManipulateSeries.AddRemoveDataSeries3DChart"
xmlns="http://schemas.microsoft.com/winfx/2006/xaml/presentation"
xmlns:x="http://schemas.microsoft.com/winfx/2006/xaml"
xmlns:d="http://schemas.microsoft.com/expression/blend/2008"
xmlns:ext="http://schemas.abtsoftware.co.uk/scichart/exampleExternals"
xmlns:mc="http://schemas.openxmlformats.org/markup-compatibility/2006"
xmlns:s3D="http://schemas.abtsoftware.co.uk/scichart3D"
xmlns:system="clr-namespace:System;assembly=mscorlib"
d:DesignHeight="400"
d:DesignWidth="600"
mc:Ignorable="d">
<UserControl.Resources>
<ResourceDictionary>
<ResourceDictionary.MergedDictionaries>
<ResourceDictionary Source="/SciChart.Examples.ExternalDependencies;component/Resources/Styles/MergedResources.xaml" />
</ResourceDictionary.MergedDictionaries>
<Style x:Key="AddSeriesTextStyle" TargetType="TextBlock">
<Setter Property="Text" Value="Add a series to the chart." />
<Style.Triggers>
<DataTrigger Binding="{Binding CanAddSeries, RelativeSource={RelativeSource AncestorType=UserControl}}" Value="False">
<Setter Property="Text" Value="Limit of series has been reached." />
</DataTrigger>
</Style.Triggers>
</Style>
<Style x:Key="RemoveSeriesTextStyle" TargetType="TextBlock">
<Setter Property="Text" Value="Now remove a previously created series!" />
<Style.Triggers>
<DataTrigger Binding="{Binding CanRemoveSeries, RelativeSource={RelativeSource AncestorType=UserControl}}" Value="False">
<Setter Property="Text" Value="There are no series." />
</DataTrigger>
</Style.Triggers>
</Style>
</ResourceDictionary>
</UserControl.Resources>
<Grid>
<Grid.ColumnDefinitions>
<ColumnDefinition Width="Auto" />
<ColumnDefinition Width="*" />
</Grid.ColumnDefinitions>
<!-- The SciChart3DInteractionToolbar adds rotate, orbit, zoom, pan, zoom extents functionality -->
<!-- to the chart and is included for example purposes. -->
<!-- If you wish to know how to zoom and pan a 3D chart then do a search for Zoom Pan in the Examples suite! -->
<ext:SciChart3DInteractionToolbar TargetSurface="{Binding Source={x:Reference Name=sciChart}}" >
<ext:FlyoutMenuButton Click="AddSeriesButton_OnClick"
Content="ADD"
Padding="0"
Style="{StaticResource FlyoutMenuButtonStyle}">
<ext:FlyoutMenuButton.PopupContent>
<StackPanel MinWidth="150" Orientation="Vertical">
<TextBlock Style="{StaticResource AddSeriesTextStyle}" />
</StackPanel>
</ext:FlyoutMenuButton.PopupContent>
</ext:FlyoutMenuButton>
<ext:FlyoutMenuButton x:Name="deleteSeriesButton"
Click="DeleteSeriesButton_OnClick"
Content="DEL"
Padding="0"
Style="{StaticResource FlyoutMenuButtonStyle}">
<ext:FlyoutMenuButton.PopupContent>
<StackPanel MinWidth="150" Orientation="Vertical">
<TextBlock Style="{StaticResource RemoveSeriesTextStyle}" />
</StackPanel>
</ext:FlyoutMenuButton.PopupContent>
</ext:FlyoutMenuButton>
</ext:SciChart3DInteractionToolbar>
<s3D:SciChart3DSurface x:Name="sciChart"
Grid.Column="1"
BorderThickness="0"
WorldDimensions="200,100,200">
<s3D:SciChart3DSurface.Camera>
<s3D:Camera3D ZoomToFitOnAttach="True" />
</s3D:SciChart3DSurface.Camera>
<s3D:SciChart3DSurface.XAxis>
<s3D:NumericAxis3D GrowBy="0.1, 0.1" />
</s3D:SciChart3DSurface.XAxis>
<s3D:SciChart3DSurface.YAxis>
<s3D:NumericAxis3D GrowBy="0.1, 0.1" />
</s3D:SciChart3DSurface.YAxis>
<s3D:SciChart3DSurface.ZAxis>
<s3D:NumericAxis3D GrowBy="0.1, 0.1" />
</s3D:SciChart3DSurface.ZAxis>
<s3D:SciChart3DSurface.ChartModifier>
<s3D:ModifierGroup3D>
<s3D:LegendModifier3D LegendPlacement="Inside" Margin="10" ShowLegend="True" SourceMode="AllSeries" />
</s3D:ModifierGroup3D>
</s3D:SciChart3DSurface.ChartModifier>
</s3D:SciChart3DSurface>
<!-- Some help text for example -->
<StackPanel Grid.Column="1"
VerticalAlignment="Top"
HorizontalAlignment="Center"
Orientation="Vertical">
<StackPanel Margin="5,10,0,0" Orientation="Horizontal">
<TextBlock FontSize="20"
Opacity="0.7"
Background="#232323"
Margin="0 0 5 0"
Text="Add one or more series to the chart. Click "
Foreground="#FFF" />
<Image Width="32"
Height="32"
Source="/SciChart.Examples;component/Resources/Images/add_button.png"
Stretch="None" />
</StackPanel>
<StackPanel Margin="5,10,0,0" Orientation="Horizontal">
<TextBlock FontSize="20"
Opacity="0.7"
Background="#232323"
Margin="0 0 5 0"
Text="Now delete last added series. Click "
Foreground="#FFF" />
<Image Width="32"
Height="32"
Source="/SciChart.Examples;component/Resources/Images/del_button.png"
Stretch="None" />
</StackPanel>
</StackPanel>
</Grid>
</UserControl>
AddRemoveDataSeries3DChart.xaml.cs
View source code// *************************************************************************************
// SCICHART® Copyright SciChart Ltd. 2011-2022. All rights reserved.
//
// Web: http://www.scichart.com
// Support: support@scichart.com
// Sales: sales@scichart.com
//
// AddRemoveDataSeries3DChart.xaml.cs is part of the SCICHART® Examples. Permission is hereby granted
// to modify, create derivative works, distribute and publish any part of this source
// code whether for commercial, private or personal use.
//
// The SCICHART® examples are distributed in the hope that they will be useful, but
// without any warranty. It is provided "AS IS" without warranty of any kind, either
// expressed or implied.
// *************************************************************************************
using System;
using System.ComponentModel;
using System.Linq;
using System.Windows;
using System.Windows.Controls;
using System.Windows.Media;
using SciChart.Charting3D.Model;
using SciChart.Charting3D.PointMarkers;
using SciChart.Charting3D.RenderableSeries;
using SciChart.Examples.ExternalDependencies.Data;
namespace SciChart.Examples.Examples.Charts3D.ManipulateSeries
{
/// <summary>
/// Interaction logic for AddRemoveDataSeries3DChart.xaml
/// </summary>
public partial class AddRemoveDataSeries3DChart : UserControl, INotifyPropertyChanged
{
private const int MaxSeriesAmount = 15;
private int _currentSeries = 0;
public event PropertyChangedEventHandler PropertyChanged;
public AddRemoveDataSeries3DChart()
{
InitializeComponent();
}
public bool CanAddSeries
{
get { return sciChart.RenderableSeries.Count < MaxSeriesAmount; }
}
public bool CanRemoveSeries
{
get { return sciChart.RenderableSeries.Count > 0; }
}
private void AddSeriesButton_OnClick(object sender, RoutedEventArgs e)
{
if (sciChart.RenderableSeries.Count >= MaxSeriesAmount)
{
return;
}
var renderSerias = new ScatterRenderableSeries3D();
var xyzDataSeries3D = new XyzDataSeries3D<double>() {SeriesName = "Series " + ++_currentSeries};
int dataPointsCount = 15;
var random = new Random(0);
for (int i = 0; i < dataPointsCount; i++)
{
double x = DataManager.Instance.GetGaussianRandomNumber(5, 1.5);
double y = DataManager.Instance.GetGaussianRandomNumber(5, 1.5);
double z = DataManager.Instance.GetGaussianRandomNumber(5, 1.5);
// Scale is a multiplier used to increase/decrease ScatterRenderableSeries3D.ScatterPointSize
float scale = (float)((random.NextDouble() + 0.5) * 3.0);
// Color is applied to PointMetadata3D and overrides the default ScatterRenderableSeries.Stroke property
Color? randomColor = Color.FromArgb(0xFF, (byte)random.Next(50, 255), (byte)random.Next(50, 255), (byte)random.Next(50, 255));
// To declare scale and colour, add a VertextData class as the w (fourth) parameter.
// The PointMetadata3D class also has other properties defining the behaviour of the XYZ point
xyzDataSeries3D.Append(x, y, z, new PointMetadata3D(randomColor, scale));
}
var randomPicker = new Random();
int randValue = randomPicker.Next(0, 6);
switch (randValue)
{
case 0:
renderSerias.PointMarker = new CubePointMarker3D();
break;
case 1:
renderSerias.PointMarker = new EllipsePointMarker3D();
break;
case 2:
renderSerias.PointMarker = new PyramidPointMarker3D();
break;
case 3:
renderSerias.PointMarker = new QuadPointMarker3D();
break;
case 4:
renderSerias.PointMarker = new SpherePointMarker3D();
break;
case 5:
renderSerias.PointMarker = new TrianglePointMarker3D();
break;
}
renderSerias.DataSeries = xyzDataSeries3D;
sciChart.RenderableSeries.Add(renderSerias);
var index = sciChart.RenderableSeries.IndexOf(renderSerias);
xyzDataSeries3D.SeriesName = String.Format("Series #{0}", index);
OnPropertyChanged("CanAddSeries");
OnPropertyChanged("CanRemoveSeries");
sciChart.ZoomExtents();
}
private void DeleteSeriesButton_OnClick(object sender, RoutedEventArgs e)
{
if (sciChart.RenderableSeries.Any())
{
var rSeries = sciChart.RenderableSeries.LastOrDefault();
if (rSeries == null || rSeries.DataSeries == null)
return;
sciChart.RenderableSeries.Remove(rSeries);
OnPropertyChanged("CanAddSeries");
OnPropertyChanged("CanRemoveSeries");
sciChart.ZoomExtents();
}
}
protected virtual void OnPropertyChanged(string propertyName)
{
PropertyChangedEventHandler handler = PropertyChanged;
if (handler != null) handler(this, new PropertyChangedEventArgs(propertyName));
}
}
}
