WPF Chart - Examples
SciChart WPF ships with hundreds of WPF Chart Examples which you can browse, play with, view the source-code and even export each WPF Chart Example to a stand-alone Visual Studio solution. All of this is possible with the new and improved SciChart WPF Examples Suite, which ships as part of the SciChart WPF SDK.
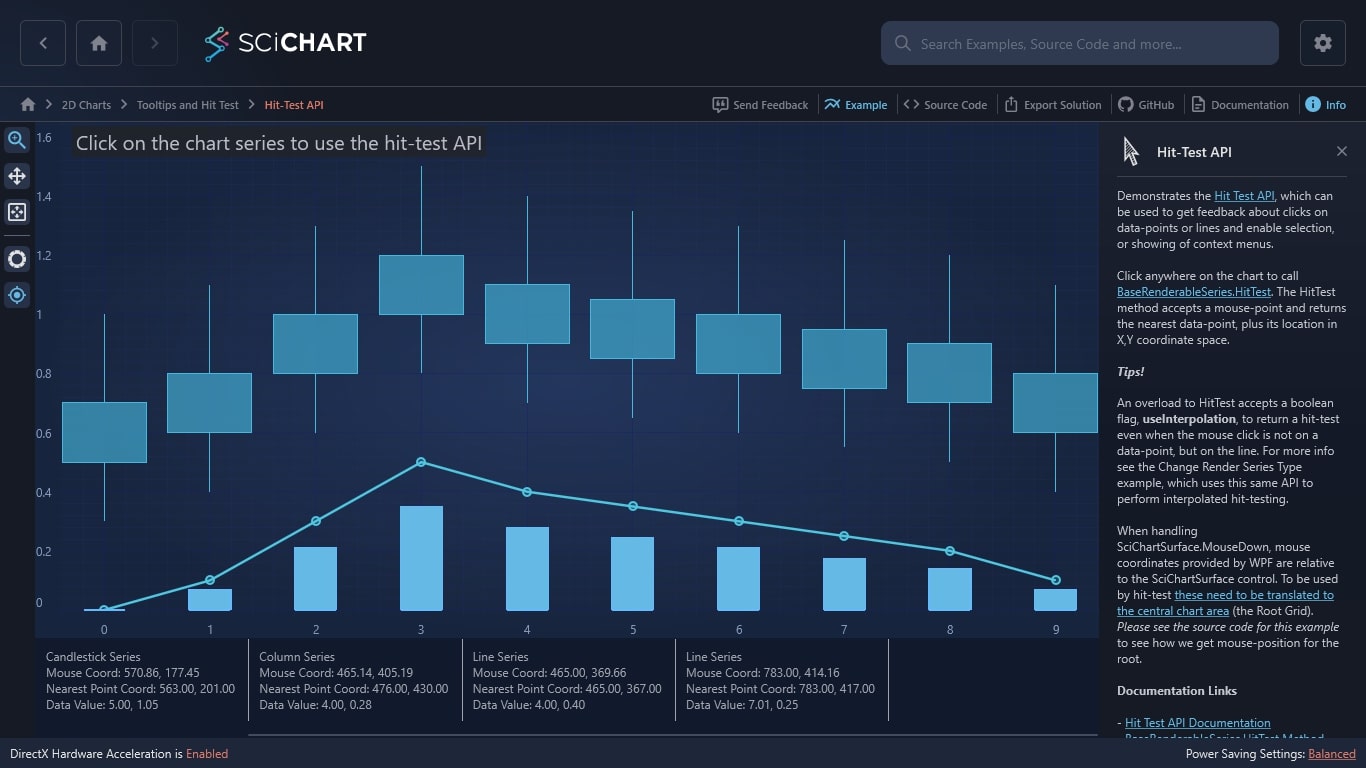
Demonstrates the Hit Test API, which can be used to get feedback about clicks on data-points or lines and enable selection, or showing of context menus.
Click anywhere on the chart to call BaseRenderableSeries.HitTest. The HitTest method accepts a mouse-point and returns the nearest data-point, plus its location in X,Y coordinate space.
Tips!
An overload to HitTest accepts a boolean flag, useInterpolation, to return a hit-test even when the mouse click is not on a data-point, but on the line. For more info see the Change Render Series Type example, which uses this same API to perform interpolated hit-testing.
When handling SciChartSurface.MouseDown, mouse coordinates provided by WPF are relative to the SciChartSurface control. To be used by hit-test these need to be translated to the central chart area (the Root Grid). Please see the source code for this example to see how we get mouse-position for the root.
Documentation Links
– Hit Test API Documentation
– BaseRenderableSeries.HitTest Method

The C#/WPF source code for the WPF Chart Hit-Test API example is included below (Scroll down!).
Did you know you can also view the source code from one of the following sources as well?
- Clone the SciChart.WPF.Examples from Github.
- Or, view source in the SciChart WPF Examples suite.
- Also the SciChart WPF Trial contains the full source for the examples (link below).
HitTestDatapoints.xaml.cs
View source code// *************************************************************************************
// SCICHART® Copyright SciChart Ltd. 2011-2022. All rights reserved.
//
// Web: http://www.scichart.com
// Support: support@scichart.com
// Sales: sales@scichart.com
//
// HitTestDatapoints.xaml.cs is part of the SCICHART® Examples. Permission is hereby granted
// to modify, create derivative works, distribute and publish any part of this source
// code whether for commercial, private or personal use.
//
// The SCICHART® examples are distributed in the hope that they will be useful, but
// without any warranty. It is provided "AS IS" without warranty of any kind, either
// expressed or implied.
// *************************************************************************************
using System;
using System.Globalization;
using System.Linq;
using System.Windows;
using System.Windows.Controls;
using System.Windows.Input;
using SciChart.Charting.Model.ChartData;
using SciChart.Charting.Model.DataSeries;
namespace SciChart.Examples.Examples.InspectDatapoints
{
public partial class HitTestDatapoints : UserControl
{
public HitTestDatapoints()
{
InitializeComponent();
// Append some data
var series0 = new UniformXyDataSeries<double> { SeriesName = "Line Series"};
series0.Append(new[] { 0, 0.1, 0.3, 0.5, 0.4, 0.35, 0.3, 0.25, 0.2, 0.1 });
renderableLineSeries.DataSeries = series0;
var series1 = new UniformXyDataSeries<double> { SeriesName = "Column Series"};
series1.Append(series0.YValues.Select(x => x * 0.7));
renderableColumnSeries.DataSeries = series1;
var series2 = new OhlcDataSeries<double, double> { SeriesName = "Candlestick Series" };
series2.Append(new double[] { 0, 1, 2, 3, 4, 5, 6, 7, 8, 9 },
series0.YValues.Select(x => x + 0.5),
series0.YValues.Select(x => x + 1.0),
series0.YValues.Select(x => x + 0.3),
series0.YValues.Select(x => x + 0.7));
renderableCandlestickSeries.DataSeries = series2;
}
private void SciChartSurfaceMouseLeftButtonUp(object sender, MouseButtonEventArgs e)
{
// Perform the hit test relative to the GridLinesPanel
var hitTestPoint = e.GetPosition(sciChartSurface.GridLinesPanel as UIElement);
// Show info for series, which HitTest operation was successful for only
foreach(var renderableSeries in sciChartSurface.RenderableSeries)
{
// Get hit-test the RenderableSeries using interpolation
var hitTestInfo = renderableSeries.HitTestProvider.HitTest(hitTestPoint, true);
if (hitTestInfo.IsHit)
{
// Convert the result of hit-test operation to SeriesInfo
var seriesInfo = renderableSeries.GetSeriesInfo(hitTestInfo);
// Output result
var formattedString = SeriesInfoToFormattedString(seriesInfo, hitTestPoint);
// Show result
Console.WriteLine(formattedString);
AddOnView(formattedString);
}
}
}
private string SeriesInfoToFormattedString(SeriesInfo seriesInfo, Point hitTestPoint)
{
return string.Format(CultureInfo.InvariantCulture,
"{0}\nMouse Coord: {1:N2}, {2:N2}\nNearest Point Coord: {3:N2}, {4:N2} \nData Value: {5:N2}, {6:N2}",
seriesInfo.SeriesName,
seriesInfo.XyCoordinate.X, seriesInfo.XyCoordinate.Y,
hitTestPoint.X, hitTestPoint.Y,
seriesInfo.XValue, seriesInfo.YValue);
}
private void AddOnView(string formattedString)
{
var newItem = new ListBoxItem {Content = formattedString};
hitTestListBox.Items.Add(newItem);
hitTestListBox.ScrollIntoView(newItem);
}
}
}HitTestDatapoints.xaml
View source code<UserControl x:Class="SciChart.Examples.Examples.InspectDatapoints.HitTestDatapoints"
xmlns="http://schemas.microsoft.com/winfx/2006/xaml/presentation"
xmlns:x="http://schemas.microsoft.com/winfx/2006/xaml"
xmlns:d="http://schemas.microsoft.com/expression/blend/2008"
xmlns:ext="http://schemas.abtsoftware.co.uk/scichart/exampleExternals"
xmlns:mc="http://schemas.openxmlformats.org/markup-compatibility/2006"
xmlns:s="http://schemas.abtsoftware.co.uk/scichart"
d:DesignHeight="400"
d:DesignWidth="600"
mc:Ignorable="d">
<Grid Background="#FF1C1C1E">
<Grid.RowDefinitions>
<RowDefinition Height="*" />
<RowDefinition Height="100" />
</Grid.RowDefinitions>
<Grid.ColumnDefinitions>
<ColumnDefinition Width="Auto" />
<ColumnDefinition Width="*" />
</Grid.ColumnDefinitions>
<!-- The SciChartInteractionToolbar adds zoom, pan, zoom extents and rotate functionality -->
<!-- to the chart and is included for example purposes. -->
<!-- If you wish to know how to zoom and pan a chart then do a search for Zoom Pan in the Examples suite! -->
<ext:SciChartInteractionToolbar Grid.RowSpan="2" TargetSurface="{Binding Source={x:Reference Name=sciChartSurface}}" />
<s:SciChartSurface x:Name="sciChartSurface"
Grid.Row="0" Grid.Column="1"
MouseLeftButtonUp="SciChartSurfaceMouseLeftButtonUp">
<!-- Declare line RenderableSeries with a circular point marker -->
<s:SciChartSurface.RenderableSeries>
<!-- Line Series -->
<s:FastLineRenderableSeries x:Name="renderableLineSeries"
Stroke="SteelBlue"
StrokeThickness="3">
<s:FastLineRenderableSeries.PointMarker>
<s:EllipsePointMarker Width="10"
Height="10"
Fill="Lavender"
Stroke="SteelBlue"
StrokeThickness="2" />
</s:FastLineRenderableSeries.PointMarker>
</s:FastLineRenderableSeries>
<!-- Column Series -->
<s:FastColumnRenderableSeries x:Name="renderableColumnSeries" />
<!-- Candlestick Series -->
<s:FastCandlestickRenderableSeries x:Name="renderableCandlestickSeries" />
</s:SciChartSurface.RenderableSeries>
<!-- Declare Axes -->
<s:SciChartSurface.XAxis>
<s:NumericAxis />
</s:SciChartSurface.XAxis>
<s:SciChartSurface.YAxis>
<s:NumericAxis AxisAlignment="Left" GrowBy="0.0, 0.1" />
</s:SciChartSurface.YAxis>
<s:SciChartSurface.ChartModifier>
<s:ModifierGroup>
<s:CursorModifier ShowAxisLabels="True"
ShowTooltip="False"
UseInterpolation="True"
ReceiveHandledEvents="True" />
</s:ModifierGroup>
</s:SciChartSurface.ChartModifier>
<s:SciChartSurface.Annotations>
<s:TextAnnotation Margin="5,10,0,0"
Background="#232323"
CoordinateMode="Relative"
FontSize="20"
Foreground="#FFF"
HorizontalAnchorPoint="Left"
Opacity="0.7"
Text="Click on the chart series to use the hit-test API"
VerticalAnchorPoint="Center"
X1="0"
Y1="0" />
</s:SciChartSurface.Annotations>
</s:SciChartSurface>
<!-- Listbox to demonstrate hit-test results -->
<ListBox x:Name="hitTestListBox"
Grid.Row="1"
Grid.Column="1"
HorizontalAlignment="Left"
Background="#FF1C1C1E"
BorderThickness="0"
Foreground="White"
Opacity="0.6">
<ListBox.ItemsPanel>
<ItemsPanelTemplate>
<StackPanel Orientation="Horizontal" />
</ItemsPanelTemplate>
</ListBox.ItemsPanel>
<ListBox.ItemContainerStyle>
<Style TargetType="ListBoxItem">
<Setter Property="BorderThickness" Value="0,0,1,0" />
<Setter Property="BorderBrush" Value="White" />
<Setter Property="Padding" Value="10,5" />
</Style>
</ListBox.ItemContainerStyle>
</ListBox>
</Grid>
</UserControl>