WPF Chart - Examples
SciChart WPF ships with hundreds of WPF Chart Examples which you can browse, play with, view the source-code and even export each WPF Chart Example to a stand-alone Visual Studio solution. All of this is possible with the new and improved SciChart WPF Examples Suite, which ships as part of the SciChart WPF SDK.
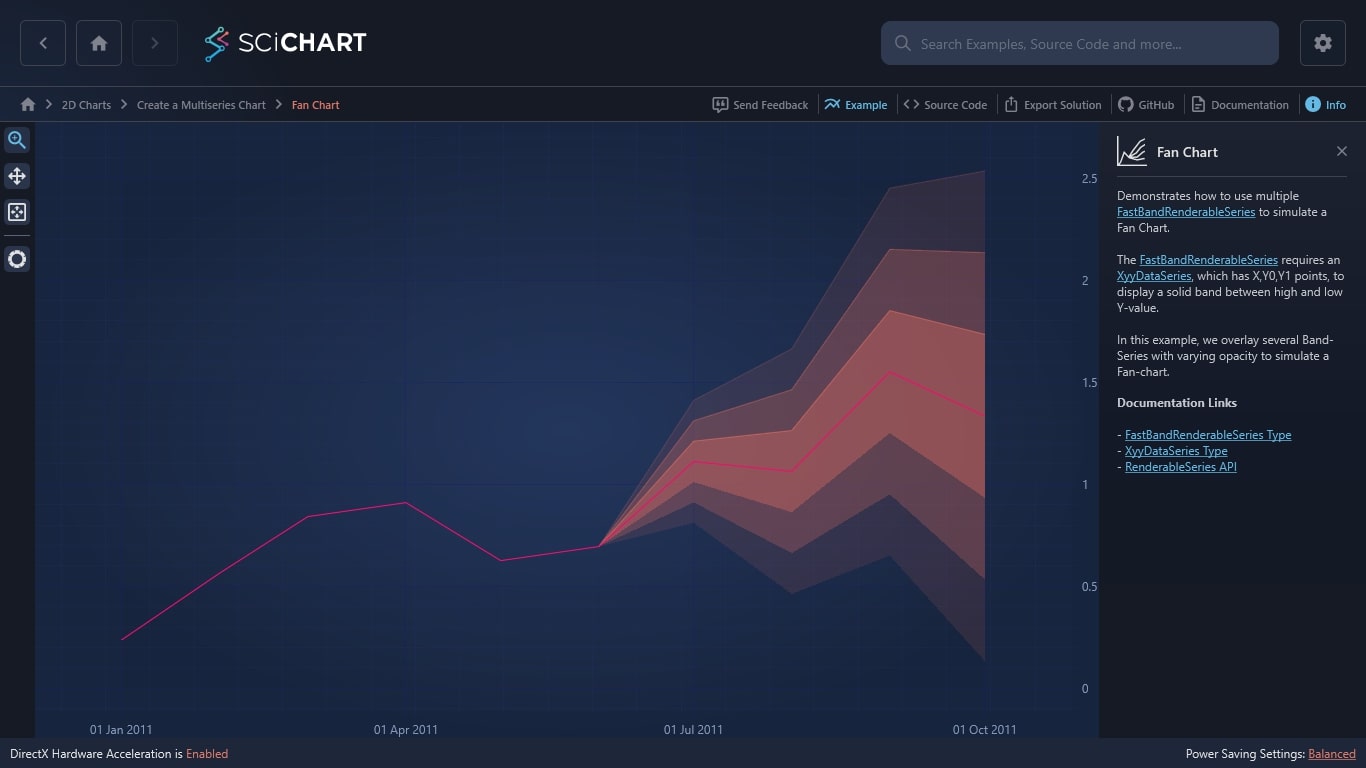
Our WPF Fan Chart example demonstrates how to use multiple FastBandRenderableSeries. SciChart’s award-winning WPF
The FastBandRenderableSeries requires an XyyDataSeries, which has X,Y0,Y1 points, to display a solid band between high and low Y-value.
In this example, we overlay several Band-Series with varying opacity to simulate a Fan-chart.
Documentation Links
– FastBandRenderableSeries Type
– XyyDataSeries Type
– RenderableSeries API
Ready to build your WPF Fan Chart?
The C#/WPF source code for the WPF Fan Chart Example is included below.
You can also view the source code from one of the following sources:
- Clone the SciChart.WPF.Examples from Github.
- View source in the SciChart WPF Examples suite.
- SciChart WPF Trial contains the full source for the examples.
Download the WPF Examples or begin your free trial today.
How to get started:
Ready to get started with your free 30-day trial? Read our Getting Started guide:
- Begin your free trial
- Create charts with tutorials
- Compile example source code
- Access documentation
Start building your high performance data visualization dashboards and web applications with a free trial of SciChart.WPF. No credit card details are required.
Get Started With Your Free Trial Today
Real-World, Big-Data Use Cases
We help developers build the best possible data visualization enhancements so your data dashboards can work smarter and deliver the best results. You’ll find our charts in WPF desktop applications for leading enterprises across the globe. We work with a wide range of sectors, including healthcare, research and finances. Built for real-world, big-data projects, we’re on the pulse of the trends and the data presentation enhancements that companies are looking for.
Built for Developers, by Developers
Our easy to use interface and XAML/MVVM Friendly API mean your developers will have a smooth experience building all your WPF charts. Feature rich, our software supports endless color customizations and configurations.
With world-class tech assistance, your developers will also have responsive support to ensure you’re getting the most out of your WPF software.
Why Use SciChart?
Since 2012, our team has been building charting software that’s built with real-world, big-data applications in mind. We’re not only the world’s fastest WPF Chart Library, we’re also recognised for our fantastic tech support and user-friendly API, earning us a 98% customer recommendation rating.
- In-house in-house GPU accelerated graphics engine
- Extensive features & customizations
- World-class support for developers
- Winner of the Queen’s Award for Innovation
- 98% of customers recommend SciChart
Frequently Asked Questions
How does the trial licence work?
Our trial is completely free for 30 days. All you have to do is sign-up and follow the instructions online. You’ll have access to our WPF library and tech support.
Can the licence be downloaded on multiple devices?
Yes – you can download across multiple devices. The licence is designed for one member of your team, but if you have a hybrid work set-up, you can download on a laptop and desktop.
What customization options are available for the WPF Fan Chart?
We support endless customizations. You can either select from our ready-made optimizations or build your own custom themes.

The C#/WPF source code for the WPF Fan Chart example is included below (Scroll down!).
Did you know you can also view the source code from one of the following sources as well?
- Clone the SciChart.WPF.Examples from Github.
- Or, view source in the SciChart WPF Examples suite.
- Also the SciChart WPF Trial contains the full source for the examples (link below).
FanChartExampleView.xaml
View source code<UserControl x:Class="SciChart.Examples.Examples.CreateMultiseriesChart.FanChartExampleView"
xmlns="http://schemas.microsoft.com/winfx/2006/xaml/presentation"
xmlns:x="http://schemas.microsoft.com/winfx/2006/xaml"
xmlns:s="http://schemas.abtsoftware.co.uk/scichart"
xmlns:mc="http://schemas.openxmlformats.org/markup-compatibility/2006"
xmlns:d="http://schemas.microsoft.com/expression/blend/2008"
xmlns:ext="http://schemas.abtsoftware.co.uk/scichart/exampleExternals"
d:DesignHeight="400"
d:DesignWidth="600"
mc:Ignorable="d">
<Grid>
<Grid.ColumnDefinitions>
<ColumnDefinition Width="Auto" />
<ColumnDefinition Width="*" />
</Grid.ColumnDefinitions>
<!-- The SciChartInteractionToolbar adds zoom, pan, zoom extents and rotate functionality -->
<!-- to the chart and is included for example purposes. -->
<!-- If you wish to know how to zoom and pan a chart then do a search for Zoom Pan in the Examples suite! -->
<ext:SciChartInteractionToolbar TargetSurface="{Binding Source={x:Reference Name=sciChart}}" />
<s:SciChartSurface x:Name="sciChart" Padding="0" BorderThickness="0" Grid.Column="1">
<s:SciChartSurface.RenderableSeries>
<!-- Visualise the three levels of projections, e.g the Fan -->
<s:FastBandRenderableSeries x:Name="projectedVar3"
FillY1="Red"
Opacity="0.2"
Stroke="Transparent">
<s:FastBandRenderableSeries.SeriesAnimation>
<s:WaveAnimation AnimationDelay="0:0:1" Duration="0:0:1" PointDurationFraction="0.2"/>
</s:FastBandRenderableSeries.SeriesAnimation>
</s:FastBandRenderableSeries>
<s:FastBandRenderableSeries x:Name="projectedVar2"
FillY1="Red"
Opacity="0.4"
Stroke="Transparent">
<s:FastBandRenderableSeries.SeriesAnimation>
<s:WaveAnimation AnimationDelay="0:0:1" Duration="0:0:1" PointDurationFraction="0.2"/>
</s:FastBandRenderableSeries.SeriesAnimation>
</s:FastBandRenderableSeries>
<s:FastBandRenderableSeries x:Name="projectedVar1"
FillY1="Red"
Opacity="0.6"
Stroke="Transparent">
<s:FastBandRenderableSeries.SeriesAnimation>
<s:WaveAnimation AnimationDelay="0:0:1" Duration="0:0:1" PointDurationFraction="0.2"/>
</s:FastBandRenderableSeries.SeriesAnimation>
</s:FastBandRenderableSeries>
<!-- Visualize the actual (known values) line -->
<s:FastLineRenderableSeries x:Name="lineSeries" Stroke="Red">
<s:FastLineRenderableSeries.SeriesAnimation>
<s:WaveAnimation AnimationDelay="0:0:1" Duration="0:0:1" PointDurationFraction="0.2"/>
</s:FastLineRenderableSeries.SeriesAnimation>
</s:FastLineRenderableSeries>
</s:SciChartSurface.RenderableSeries>
<s:SciChartSurface.XAxis>
<s:DateTimeAxis GrowBy="0.1, 0.1" />
</s:SciChartSurface.XAxis>
<s:SciChartSurface.YAxis>
<s:NumericAxis GrowBy="0.1, 0.1" />
</s:SciChartSurface.YAxis>
</s:SciChartSurface>
</Grid>
</UserControl>
FanChartExampleView.xaml.cs
View source code// *************************************************************************************
// SCICHART® Copyright SciChart Ltd. 2011-2022. All rights reserved.
//
// Web: http://www.scichart.com
// Support: support@scichart.com
// Sales: sales@scichart.com
//
// FanChartExampleView.xaml.cs is part of the SCICHART® Examples. Permission is hereby granted
// to modify, create derivative works, distribute and publish any part of this source
// code whether for commercial, private or personal use.
//
// The SCICHART® examples are distributed in the hope that they will be useful, but
// without any warranty. It is provided "AS IS" without warranty of any kind, either
// expressed or implied.
// *************************************************************************************
using System;
using System.Collections.Generic;
using System.Linq;
using System.Windows;
using System.Windows.Controls;
using SciChart.Charting.Model.DataSeries;
using SciChart.Examples.ExternalDependencies.Data;
namespace SciChart.Examples.Examples.CreateMultiseriesChart
{
/// <summary>
/// Interaction logic for FanChartExampleView.xaml
/// </summary>
public partial class FanChartExampleView : UserControl
{
public FanChartExampleView()
{
InitializeComponent();
this.Loaded += FanChartExampleViewLoaded;
}
private void FanChartExampleViewLoaded(object sender, RoutedEventArgs e)
{
// Variance data is a 2D table containing actual values and several levels of projected high, low values
IEnumerable<VarPoint> varianceData = GetVarianceData().ToArray();
// To render the Fan, we use an XyDataSeries and three band series'
var actualDataSeries = new XyDataSeries<DateTime, double>();
var var3DataSeries = new XyyDataSeries<DateTime, double>();
var var2DataSeries = new XyyDataSeries<DateTime, double>();
var var1DataSeries = new XyyDataSeries<DateTime, double>();
// Append data values from the Variance table
actualDataSeries.Append(varianceData.Select(x => x.Date), varianceData.Select(x => x.Actual));
var3DataSeries.Append(varianceData.Select(x => x.Date), varianceData.Select(x => x.VarMin), varianceData.Select(x => x.VarMax));
var2DataSeries.Append(varianceData.Select(x => x.Date), varianceData.Select(x => x.Var1), varianceData.Select(x => x.Var4));
var1DataSeries.Append(varianceData.Select(x => x.Date), varianceData.Select(x => x.Var2), varianceData.Select(x => x.Var3));
// Assign data to renderableseries
lineSeries.DataSeries = actualDataSeries;
projectedVar3.DataSeries = var3DataSeries;
projectedVar2.DataSeries = var2DataSeries;
projectedVar1.DataSeries = var1DataSeries;
sciChart.ZoomExtents();
}
// Create a table of Variance data. Each row in the table consists of
//
// DateTime, Actual (Y-Value), Projected Min, Variance 1, 2, 3, 4 and Projected Maximum
//
// DateTime Actual Min Var1 Var2 Var3 Var4 Max
// Jan-11 y0 - - - - - -
// Feb-11 y1 - - - - - -
// Mar-11 y2 - - - - - -
// Apr-11 y3 - - - - - -
// May-11 y4 - - - - - -
// Jun-11 y5 min0 var1_0 var2_0 var3_0 var4_0 max_0
// Jul-11 y6 min1 var1_1 var2_1 var3_1 var4_1 max_1
// Aug-11 y7 min2 var1_2 var2_2 var3_2 var4_2 max_2
// Dec-11 y8 min3 var1_3 var2_3 var3_3 var4_3 max_3
// Jan-12 y9 min4 var1_4 var2_4 var3_4 var4_4 max_4
private IEnumerable<VarPoint> GetVarianceData()
{
var dates = Enumerable.Range(0, 10).Select(i => new DateTime(2011, 01, 01).AddMonths(i)).ToArray();
var yValues = new RandomWalkGenerator(seed: 0).GetRandomWalkSeries(10).YData;
for (int i = 0; i < 10; i++)
{
double varMax = double.NaN;
double var4 = double.NaN;
double var3 = double.NaN;
double var2 = double.NaN;
double var1 = double.NaN;
double varMin = double.NaN;
if (i > 4)
{
varMax = yValues[i] + (i - 5) * 0.3;
var4 = yValues[i] + (i - 5) * 0.2;
var3 = yValues[i] + (i - 5) * 0.1;
var2 = yValues[i] - (i - 5) * 0.1;
var1 = yValues[i] - (i - 5) * 0.2;
varMin = yValues[i] - (i - 5) * 0.3;
}
yield return new VarPoint(dates[i], yValues[i], var4, var3, var2, var1, varMin, varMax);
}
}
private struct VarPoint
{
public readonly DateTime Date;
public readonly double Actual;
public readonly double VarMax;
public readonly double Var4;
public readonly double Var3;
public readonly double Var2;
public readonly double Var1;
public readonly double VarMin;
public VarPoint(DateTime date, double actual, double var4, double var3, double var2, double var1, double varMin, double varMax) : this()
{
Date = date;
Actual = actual;
Var4 = var4;
Var3 = var3;
Var2 = var2;
Var1 = var1;
VarMin = varMin;
VarMax = varMax;
}
}
}
}
