WPF Chart - Examples
SciChart WPF ships with hundreds of WPF Chart Examples which you can browse, play with, view the source-code and even export each WPF Chart Example to a stand-alone Visual Studio solution. All of this is possible with the new and improved SciChart WPF Examples Suite, which ships as part of the SciChart WPF SDK.
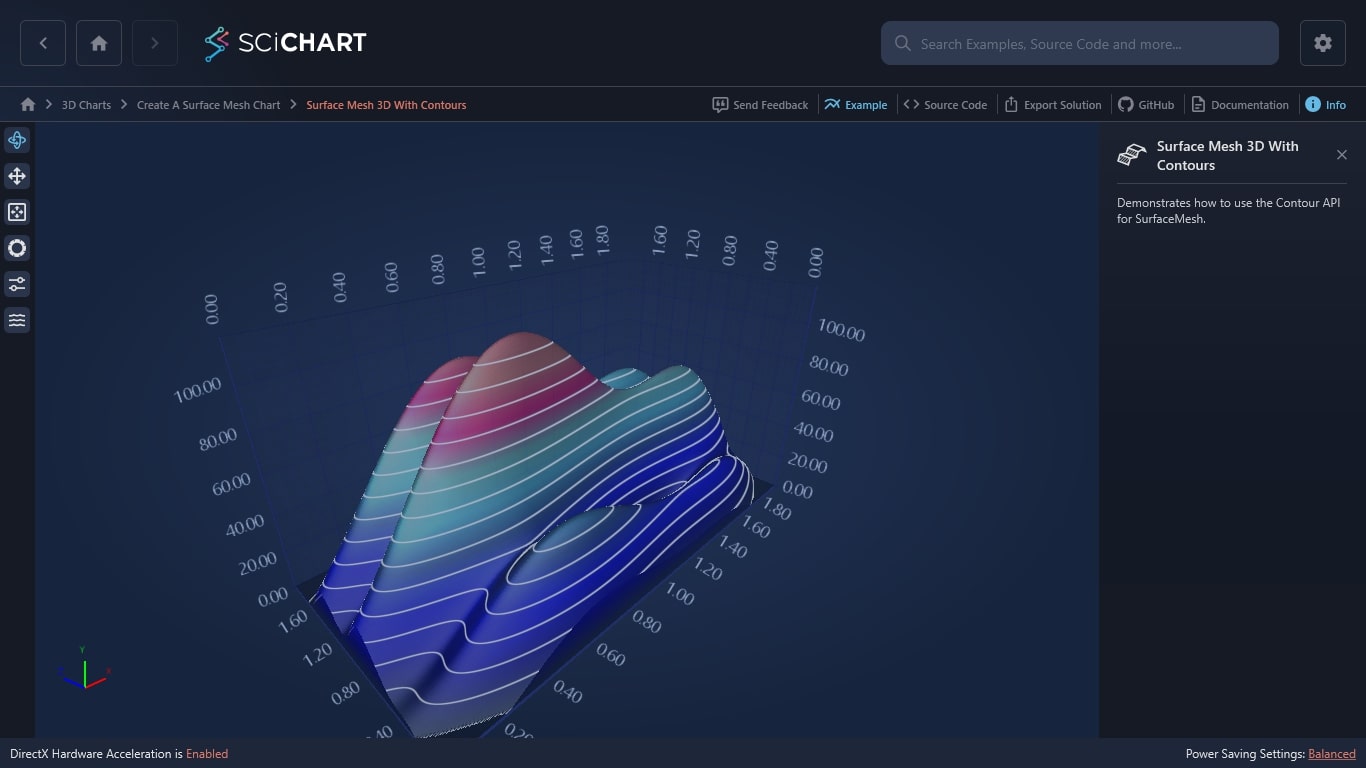
This WPF chart (3D chart) demo demonstrates how to use the Contour API for SurfaceMesh.

The C#/WPF source code for the WPF Surface 3D Mesh With Contours example is included below (Scroll down!).
Did you know you can also view the source code from one of the following sources as well?
- Clone the SciChart.WPF.Examples from Github.
- Or, view source in the SciChart WPF Examples suite.
- Also the SciChart WPF Trial contains the full source for the examples (link below).
SurfaceMeshContours.xaml
View source code<UserControl x:Class="SciChart.Examples.Examples.Charts3D.CreateASurfaceMeshChart.SurfaceMeshContours"
xmlns="http://schemas.microsoft.com/winfx/2006/xaml/presentation"
xmlns:x="http://schemas.microsoft.com/winfx/2006/xaml"
xmlns:mc="http://schemas.openxmlformats.org/markup-compatibility/2006"
xmlns:d="http://schemas.microsoft.com/expression/blend/2008"
xmlns:s3D="http://schemas.abtsoftware.co.uk/scichart3D"
xmlns:ext="http://schemas.abtsoftware.co.uk/scichart/exampleExternals"
xmlns:createASurfaceMeshChart="clr-namespace:SciChart.Examples.Examples.Charts3D.CreateASurfaceMeshChart"
mc:Ignorable="d"
d:DesignHeight="400" d:DesignWidth="600">
<UserControl.Resources>
<s3D:GradientColorPalette x:Key="HeightColorMap" ContourColor="Black" ContourStrokeThickness="2.0">
<s3D:GradientColorPalette.GradientStops>
<GradientStop Offset="1.0" Color="Brown"/>
<GradientStop Offset="0.9" Color="Brown"/>
<GradientStop Offset="0.8" Color="SaddleBrown"/>
<GradientStop Offset="0.7" Color="DarkOrange"/>
<GradientStop Offset="0.6" Color="GreenYellow"/>
<GradientStop Offset="0.5" Color="DarkSalmon"/>
<GradientStop Offset="0.4" Color="BurlyWood"/>
<GradientStop Offset="0.3" Color="DarkKhaki"/>
<GradientStop Offset="0.2" Color="ForestGreen"/>
<GradientStop Offset="0.1" Color="Green"/>
<GradientStop Offset="0.0" Color="Aqua"/>
</s3D:GradientColorPalette.GradientStops>
</s3D:GradientColorPalette>
<ext:EnumValueToStringConverter x:Key="SelectedEnumValueConverter" />
<ext:LinearToLogarithmicValueConverter x:Key="LinearToLogarithmicValueConverter"/>
</UserControl.Resources>
<Grid>
<Grid.ColumnDefinitions>
<ColumnDefinition Width="Auto"/>
<ColumnDefinition Width="*"/>
</Grid.ColumnDefinitions>
<!-- The SciChart3DInteractionToolbar adds rotate, orbit, zoom, pan, zoom extents functionality -->
<!-- to the chart and is included for example purposes. -->
<!-- If you wish to know how to zoom and pan a 3D chart then do a search for Zoom Pan in the Examples suite! -->
<ext:SciChart3DInteractionToolbar TargetSurface="{Binding Source={x:Reference Name=sciChart}}" >
<ext:FlyoutMenuButton Style="{StaticResource FlyoutMenuButtonStyle}"
Content="CTRL"
FontSize="10"
Padding="0">
<ext:FlyoutMenuButton.PopupContent>
<StackPanel Orientation="Vertical" MinWidth="150">
<!-- Checkboxes to decide how the mesh should be drawn -->
<TextBlock FontSize="12" Text="Draw Mesh As" />
<ComboBox ItemsSource="{Binding Source={ext:EnumValues {x:Type s3D:DrawMeshAs}}}" SelectedItem="{Binding Source={x:Reference surfaceMeshRenderableSeries}, Path=DrawMeshAs, Mode=TwoWay, Converter={StaticResource SelectedEnumValueConverter}}" />
<ext:FlyoutSeparator/>
<!-- Checkbox for Mesh Skirt on or off -->
<TextBlock FontSize="12" Text="Mesh Skirt" />
<CheckBox FontSize="12" Margin="4" x:Name="CheckDrawSkirt" Content="Draw Mesh Skirt?" IsChecked="True" Checked="CheckDrawSkirtChanged" Unchecked="CheckDrawSkirtChanged"/>
<ext:FlyoutSeparator/>
<!-- Create the opacity slider -->
<TextBlock FontSize="12" Text="Opacity" />
<Slider Minimum="0.1" Maximum="1.0" x:Name="opacitySlider" Value="0.8" Margin="4" Orientation="Horizontal" HorizontalAlignment="Stretch"/>
<TextBlock FontSize="12" Text="Normal hardness" />
<Slider Minimum="0.0" Maximum="1.0" x:Name="normalHardnessSlider" Value="1.0" Margin="4" Orientation="Horizontal" HorizontalAlignment="Stretch"/>
<TextBlock FontSize="12" Text="Shininess" />
<Slider Minimum="0" Maximum="11" x:Name="shininessSlider" Margin="4" Orientation="Horizontal" HorizontalAlignment="Stretch"/>
</StackPanel>
</ext:FlyoutMenuButton.PopupContent>
</ext:FlyoutMenuButton>
<ext:FlyoutMenuButton Style="{StaticResource FlyoutMenuButtonStyle}"
Content="Cont"
FontSize="10"
Padding="0">
<ext:FlyoutMenuButton.PopupContent>
<StackPanel Orientation="Vertical" MinWidth="150">
<!-- Create the contour thickness slider -->
<TextBlock FontSize="12" Text="Contour thickness" />
<Slider Minimum="1" Maximum="5" x:Name="contourThicknessSlider" Value="1" Margin="4" Orientation="Horizontal" HorizontalAlignment="Stretch"/>
<!-- Create the contour inteval slider -->
<TextBlock FontSize="12" Text="Contour inteval" />
<Slider Minimum="2" Maximum="30" x:Name="contourIntervalSlider" Value="20" Margin="4" Orientation="Horizontal" HorizontalAlignment="Stretch"/>
<!-- Create the contour offset slider -->
<TextBlock FontSize="12" Text="Contour offset" />
<Slider Minimum="0.1" Maximum="30" x:Name="contourOffsetSlider" Value="0.1" Margin="4" Orientation="Horizontal" HorizontalAlignment="Stretch"/>
<!-- The contour color -->
<TextBlock FontSize="12" Text="Contour color" />
<ComboBox x:Name="contourComboBox"
Width="200"
Margin="3"
Background="#FF1C1C1F"
SelectedIndex="1"
SelectionChanged="ContourColorSelectionChanged">
<ComboBox.ItemTemplate>
<DataTemplate DataType="createASurfaceMeshChart:ColorModel">
<StackPanel Orientation="Horizontal">
<Rectangle Width="18"
Height="{Binding RelativeSource={RelativeSource Mode=Self}, Path=Width}"
Margin="3 0"
Fill="{Binding Brush}"
RadiusX="2"
RadiusY="2" />
<TextBlock Margin="3 0"
VerticalAlignment="Center"
FontSize="14"
Foreground="White"
Text="{Binding ColorName}" />
</StackPanel>
</DataTemplate>
</ComboBox.ItemTemplate>
</ComboBox>
</StackPanel>
</ext:FlyoutMenuButton.PopupContent>
</ext:FlyoutMenuButton>
</ext:SciChart3DInteractionToolbar>
<s3D:SciChart3DSurface x:Name="sciChart" Grid.Column="1" BorderThickness="0" WorldDimensions="600,300,300">
<s3D:SciChart3DSurface.RenderableSeries>
<s3D:SurfaceMeshRenderableSeries3D x:Name="surfaceMeshRenderableSeries"
DrawMeshAs="SolidWithContours"
ContourStrokeThickness="{Binding Source={x:Reference contourThicknessSlider}, Path=Value, Mode=TwoWay}"
ContourInterval="{Binding Source={x:Reference contourIntervalSlider}, Path=Value, Mode=TwoWay}"
ContourOffset="{Binding Source={x:Reference contourOffsetSlider}, Path=Value, Mode=TwoWay}"
Stroke="#77228B22"
Maximum="150"
StrokeThickness="2.0"
DrawSkirt="True"
Opacity="{Binding Source={x:Reference opacitySlider}, Path=Value, Mode=TwoWay}"
CellHardnessFactor="{Binding Source={x:Reference Name=normalHardnessSlider}, Path=Value, Mode=TwoWay}"
Shininess="{Binding Source={x:Reference Name=shininessSlider}, Path=Value, Mode=TwoWay, Converter={StaticResource LinearToLogarithmicValueConverter}}"
MeshColorPalette="{StaticResource HeightColorMap}"/>
</s3D:SciChart3DSurface.RenderableSeries>
<s3D:SciChart3DSurface.XAxis>
<s3D:NumericAxis3D />
</s3D:SciChart3DSurface.XAxis>
<s3D:SciChart3DSurface.YAxis>
<s3D:NumericAxis3D />
</s3D:SciChart3DSurface.YAxis>
<s3D:SciChart3DSurface.ZAxis>
<s3D:NumericAxis3D />
</s3D:SciChart3DSurface.ZAxis>
</s3D:SciChart3DSurface>
</Grid>
</UserControl>
SurfaceMeshContours.xaml.cs
View source codeusing System;
using System.Drawing;
using System.Linq;
using System.Windows;
using System.Windows.Controls;
using System.Windows.Media;
using SciChart.Charting.Model.DataSeries;
using SciChart.Charting.Model.DataSeries.Heatmap2DArrayDataSeries;
using SciChart.Charting.Visuals.RenderableSeries;
using SciChart.Charting3D.Model;
using SciChart.Charting3D.RenderableSeries;
using Brush = System.Windows.Media.Brush;
using Brushes = System.Windows.Media.Brushes;
using Color = System.Windows.Media.Color;
namespace SciChart.Examples.Examples.Charts3D.CreateASurfaceMeshChart
{
/// <summary>
/// Interaction logic for CreateAContouredChart.xaml
/// </summary>
public partial class SurfaceMeshContours : UserControl
{
public SurfaceMeshContours()
{
InitializeComponent();
var meshDataSeries = FillSeries(0, 200, 200);
surfaceMeshRenderableSeries.DataSeries = meshDataSeries;
contourComboBox.ItemsSource = typeof(Colors).GetProperties().Select(x => new ColorModel { ColorName = x.Name, Color = (Color)x.GetValue(null, null) }).ToList();
}
private void CheckDrawSkirtChanged(object sender, RoutedEventArgs e)
{
if (surfaceMeshRenderableSeries != null)
{
surfaceMeshRenderableSeries.DrawSkirt = CheckDrawSkirt.IsChecked == true;
}
}
private IDataSeries3D FillSeries(int index, int width, int height)
{
double angle = Math.PI*2*index/30;
int w = width, h = height;
var dataSeries = new UniformGridDataSeries3D<double>(w, h)
{
StepX = 0.01,
StepZ = 0.01,
};
for (int x = 0; x < 200; x++)
{
for (int y = 0; y < 200; y++)
{
var v = (1 + Math.Sin(x*0.04 + angle))*50 + (1 + Math.Sin(y*0.1 + angle))*50*(1 + Math.Sin(angle*2));
var cx = w/2;
var cy = h/2;
var r = Math.Sqrt((x - cx)*(x - cx) + (y - cy)*(y - cy));
var exp = Math.Max(0, 1 - r*0.008);
var zValue = v*exp;
dataSeries[y, x] = zValue;
}
}
return dataSeries;
}
private void ContourColorSelectionChanged(object sender, SelectionChangedEventArgs e)
{
surfaceMeshRenderableSeries.ContourStroke = ((ColorModel)contourComboBox.SelectedItem).Color;
}
}
public class ColorModel
{
public Color Color { get; set; }
public Brush Brush
{
get { return new SolidColorBrush(Color); }
}
public string ColorName { get; set; }
}
}