WPF Chart - Examples
SciChart WPF ships with hundreds of WPF Chart Examples which you can browse, play with, view the source-code and even export each WPF Chart Example to a stand-alone Visual Studio solution. All of this is possible with the new and improved SciChart WPF Examples Suite, which ships as part of the SciChart WPF SDK.
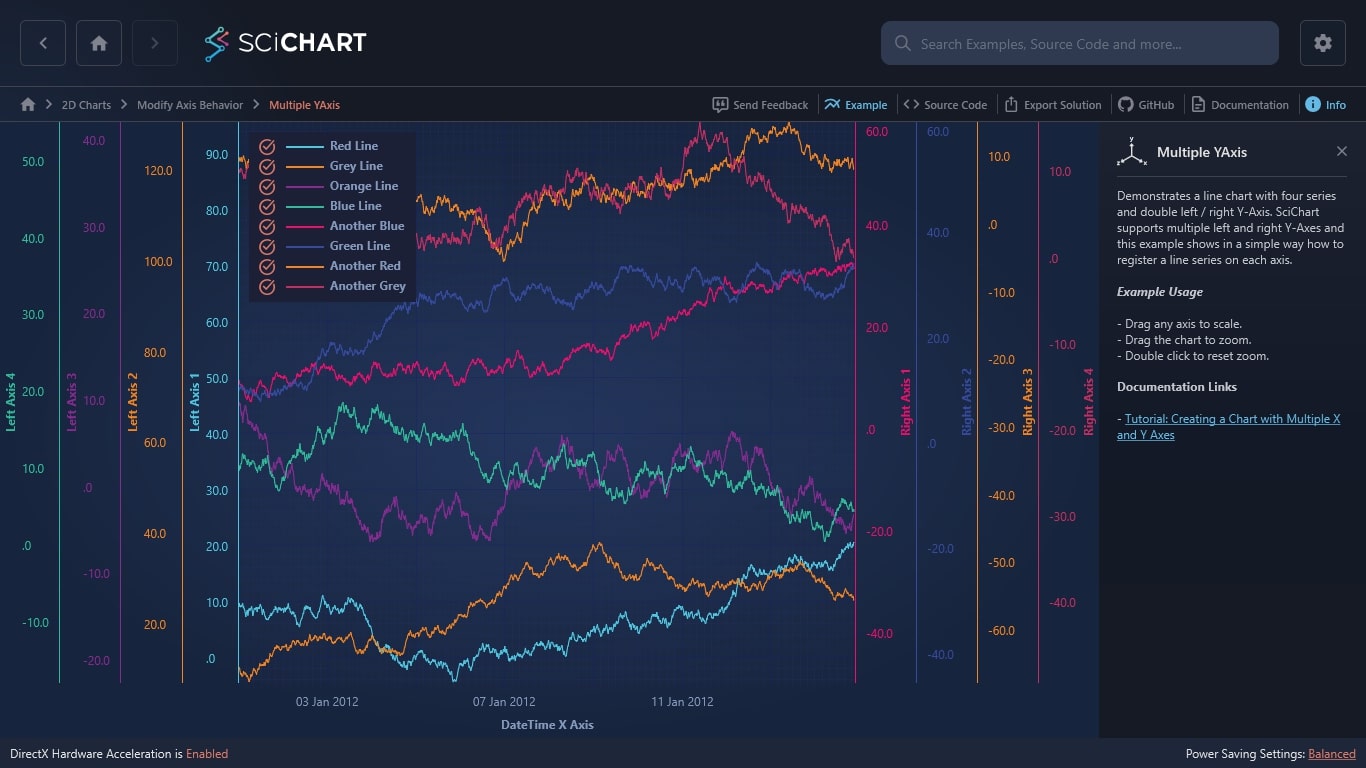
Demonstrates a line chart with four series and double left / right Y-Axis. SciChart supports multiple left and right Y-Axes and this example shows in a simple way how to register a line series on each axis.
Example Usage
– Drag any axis to scale.
– Drag the chart to zoom.
– Double click to reset zoom.
Documentation Links

The C#/WPF source code for the WPF Chart Multiple YAxis example is included below (Scroll down!).
Did you know you can also view the source code from one of the following sources as well?
- Clone the SciChart.WPF.Examples from Github.
- Or, view source in the SciChart WPF Examples suite.
- Also the SciChart WPF Trial contains the full source for the examples (link below).
QuadLeftRightAxes.xaml
View source code<UserControl x:Class="SciChart.Examples.Examples.ModifyAxisBehaviour.QuadLeftRightAxes"
xmlns="http://schemas.microsoft.com/winfx/2006/xaml/presentation"
xmlns:x="http://schemas.microsoft.com/winfx/2006/xaml"
xmlns:d="http://schemas.microsoft.com/expression/blend/2008"
xmlns:mc="http://schemas.openxmlformats.org/markup-compatibility/2006"
xmlns:s="http://schemas.abtsoftware.co.uk/scichart"
Loaded="QuadLeftRightAxes_Loaded"
d:DesignHeight="400"
d:DesignWidth="600"
mc:Ignorable="d">
<UserControl.Resources>
<!-- Growby's are not necessary but are used to push series into top/bottom half of the chart, to give a cleaner visual appearance -->
<s:DoubleRange x:Key="GrowBy1"
Max="3.0"
Min="0" />
<s:DoubleRange x:Key="GrowBy2"
Max="2.0"
Min="1.0" />
<s:DoubleRange x:Key="GrowBy3"
Max="1.0"
Min="2.0" />
<s:DoubleRange x:Key="GrowBy4"
Max="0"
Min="3.0" />
</UserControl.Resources>
<Grid>
<!-- Create the chart surface -->
<s:SciChartSurface Name="sciChart">
<!-- Declare RenderableSeries and assign to Y-Axis -->
<s:SciChartSurface.RenderableSeries>
<s:FastLineRenderableSeries Stroke="#FFFF1919"
StrokeThickness="1"
YAxisId="Left1" />
<s:FastLineRenderableSeries Stroke="#FFCCCCCC"
StrokeThickness="1"
YAxisId="Left2" />
<s:FastLineRenderableSeries Stroke="#FFFC9C29"
StrokeThickness="1"
YAxisId="Left3" />
<s:FastLineRenderableSeries Stroke="#FF4083B7"
StrokeThickness="1"
YAxisId="Left4" />
<s:FastLineRenderableSeries Stroke="#FF4083B7"
StrokeThickness="1"
YAxisId="Right1" />
<s:FastLineRenderableSeries Stroke="#FF279B27"
StrokeThickness="1"
YAxisId="Right2" />
<s:FastLineRenderableSeries Stroke="#FFFF1919"
StrokeThickness="1"
YAxisId="Right3" />
<s:FastLineRenderableSeries Stroke="#FFCCCCCC"
StrokeThickness="1"
YAxisId="Right4" />
</s:SciChartSurface.RenderableSeries>
<!-- Create an X Axis. Optional bands give a cool look and feel for minimal performance impact -->
<s:SciChartSurface.XAxis>
<s:DateTimeAxis AxisTitle="DateTime X Axis" />
</s:SciChartSurface.XAxis>
<!-- Create Y Axes on the Left and Right -->
<s:SciChartSurface.YAxes>
<s:NumericAxis AxisAlignment="Left"
AxisTitle="Left Axis 1"
BorderBrush="#FFFF1919"
BorderThickness="0,0,1,0"
GrowBy="{StaticResource GrowBy1}"
Id="Left1"
TextFormatting="#.0"
TickTextBrush="#FFFF1919" />
<s:NumericAxis AxisAlignment="Left"
AxisTitle="Left Axis 2"
BorderBrush="#FFCCCCCC"
BorderThickness="0,0,1,0"
GrowBy="{StaticResource GrowBy1}"
Id="Left2"
TextFormatting="#.0"
TickTextBrush="#FFCCCCCC" />
<s:NumericAxis AxisAlignment="Left"
AxisTitle="Left Axis 3"
BorderBrush="#FFFC9C29"
BorderThickness="0,0,1,0"
GrowBy="{StaticResource GrowBy2}"
Id="Left3"
TextFormatting="#.0"
TickTextBrush="#FFFC9C29" />
<s:NumericAxis AxisAlignment="Left"
AxisTitle="Left Axis 4"
BorderBrush="#FF4083B7"
BorderThickness="0,0,1,0"
GrowBy="{StaticResource GrowBy2}"
Id="Left4"
TextFormatting="#.0"
TickTextBrush="#FF4083B7" />
<s:NumericAxis AxisAlignment="Right"
AxisTitle="Right Axis 1"
BorderBrush="#FF4083B7"
BorderThickness="1,0,0,0"
GrowBy="{StaticResource GrowBy3}"
Id="Right1"
TextFormatting="#.0"
TickTextBrush="#FF4083B7" />
<s:NumericAxis AxisAlignment="Right"
AxisTitle="Right Axis 2"
BorderBrush="#FF279B27"
BorderThickness="1,0,0,0"
GrowBy="{StaticResource GrowBy3}"
Id="Right2"
TextFormatting="#.0"
TickTextBrush="#FF279B27" />
<s:NumericAxis AxisAlignment="Right"
AxisTitle="Right Axis 3"
BorderBrush="#FFFF1919"
BorderThickness="1,0,0,0"
GrowBy="{StaticResource GrowBy4}"
Id="Right3"
TextFormatting="#.0"
TickTextBrush="#FFFF1919" />
<s:NumericAxis AxisAlignment="Right"
AxisTitle="Right Axis 4"
BorderBrush="#FFCCCCCC"
BorderThickness="1,0,0,0"
GrowBy="{StaticResource GrowBy4}"
Id="Right4"
TextFormatting="#.0"
TickTextBrush="#FFCCCCCC" />
</s:SciChartSurface.YAxes>
<!-- Create chart modifiers to zoom, drag X,Y Axes and double click to zoom extents -->
<s:SciChartSurface.ChartModifier>
<s:ModifierGroup>
<s:RubberBandXyZoomModifier IsXAxisOnly="True" />
<s:XAxisDragModifier />
<s:YAxisDragModifier AxisId="Left1" />
<s:YAxisDragModifier AxisId="Left2" />
<s:YAxisDragModifier AxisId="Left3" />
<s:YAxisDragModifier AxisId="Left4" />
<s:YAxisDragModifier AxisId="Right1" />
<s:YAxisDragModifier AxisId="Right2" />
<s:YAxisDragModifier AxisId="Right3" />
<s:YAxisDragModifier AxisId="Right4" />
<s:ZoomPanModifier ExecuteOn="MouseRightButton" />
<s:ZoomExtentsModifier ExecuteOn="MouseDoubleClick" />
<s:LegendModifier Margin="10" ShowLegend="True" />
</s:ModifierGroup>
</s:SciChartSurface.ChartModifier>
</s:SciChartSurface>
</Grid>
</UserControl>
QuadLeftRightAxes.xaml.cs
View source code// *************************************************************************************
// SCICHART® Copyright SciChart Ltd. 2011-2022. All rights reserved.
//
// Web: http://www.scichart.com
// Support: support@scichart.com
// Sales: sales@scichart.com
//
// QuadLeftRightAxes.xaml.cs is part of the SCICHART® Examples. Permission is hereby granted
// to modify, create derivative works, distribute and publish any part of this source
// code whether for commercial, private or personal use.
//
// The SCICHART® examples are distributed in the hope that they will be useful, but
// without any warranty. It is provided "AS IS" without warranty of any kind, either
// expressed or implied.
// *************************************************************************************
using System;
using System.Windows;
using System.Windows.Controls;
using SciChart.Charting.Model.DataSeries;
namespace SciChart.Examples.Examples.ModifyAxisBehaviour
{
public partial class QuadLeftRightAxes : UserControl
{
// Used to generate Random Walk
private Random _random = new Random(251916);
const int Count = 2000;
public QuadLeftRightAxes()
{
InitializeComponent();
}
private void QuadLeftRightAxes_Loaded(object sender, RoutedEventArgs e)
{
// Batch updates with one redraw
using (sciChart.SuspendUpdates())
{
// Add four data-series
var dataSeries0 = new XyDataSeries<DateTime, double>();
var dataSeries1 = new XyDataSeries<DateTime, double>();
var dataSeries2 = new XyDataSeries<DateTime, double>();
var dataSeries3 = new XyDataSeries<DateTime, double>();
var dataSeries4 = new XyDataSeries<DateTime, double>();
var dataSeries5 = new XyDataSeries<DateTime, double>();
var dataSeries6 = new XyDataSeries<DateTime, double>();
var dataSeries7 = new XyDataSeries<DateTime, double>();
// Fill each data-series with 2,000 pts of X,Y values (Date,Double) and assign to RenderableSeries
sciChart.RenderableSeries[0].DataSeries = FillData(dataSeries0, "Red Line");
sciChart.RenderableSeries[1].DataSeries = FillData(dataSeries1, "Grey Line");
sciChart.RenderableSeries[2].DataSeries = FillData(dataSeries2, "Orange Line");
sciChart.RenderableSeries[3].DataSeries = FillData(dataSeries3, "Blue Line");
sciChart.RenderableSeries[4].DataSeries = FillData(dataSeries4, "Another Blue");
sciChart.RenderableSeries[5].DataSeries = FillData(dataSeries5, "Green Line");
sciChart.RenderableSeries[6].DataSeries = FillData(dataSeries6, "Another Red");
sciChart.RenderableSeries[7].DataSeries = FillData(dataSeries7, "Another Grey");
}
sciChart.ZoomExtents();
}
private IDataSeries FillData(IXyDataSeries<DateTime, double> dataSeries, string name)
{
double randomWalk = 10.0;
var startDate = new DateTime(2012, 01, 01);
// Generate the X,Y data with sequential dates on the X-Axis and slightly positively biased random walk on the Y-Axis
var xBuffer = new DateTime[Count];
var yBuffer = new double[Count];
for (int i = 0; i < Count; i++)
{
randomWalk += (_random.NextDouble() - 0.498);
yBuffer[i] = randomWalk;
xBuffer[i] = startDate.AddMinutes(i * 10);
}
// Buffer above and append all in one go to avoid multiple recalculations of series range
dataSeries.Append(xBuffer, yBuffer);
dataSeries.SeriesName = name;
return dataSeries;
}
}
}
