WPF Chart - Examples
SciChart WPF ships with hundreds of WPF Chart Examples which you can browse, play with, view the source-code and even export each WPF Chart Example to a stand-alone Visual Studio solution. All of this is possible with the new and improved SciChart WPF Examples Suite, which ships as part of the SciChart WPF SDK.
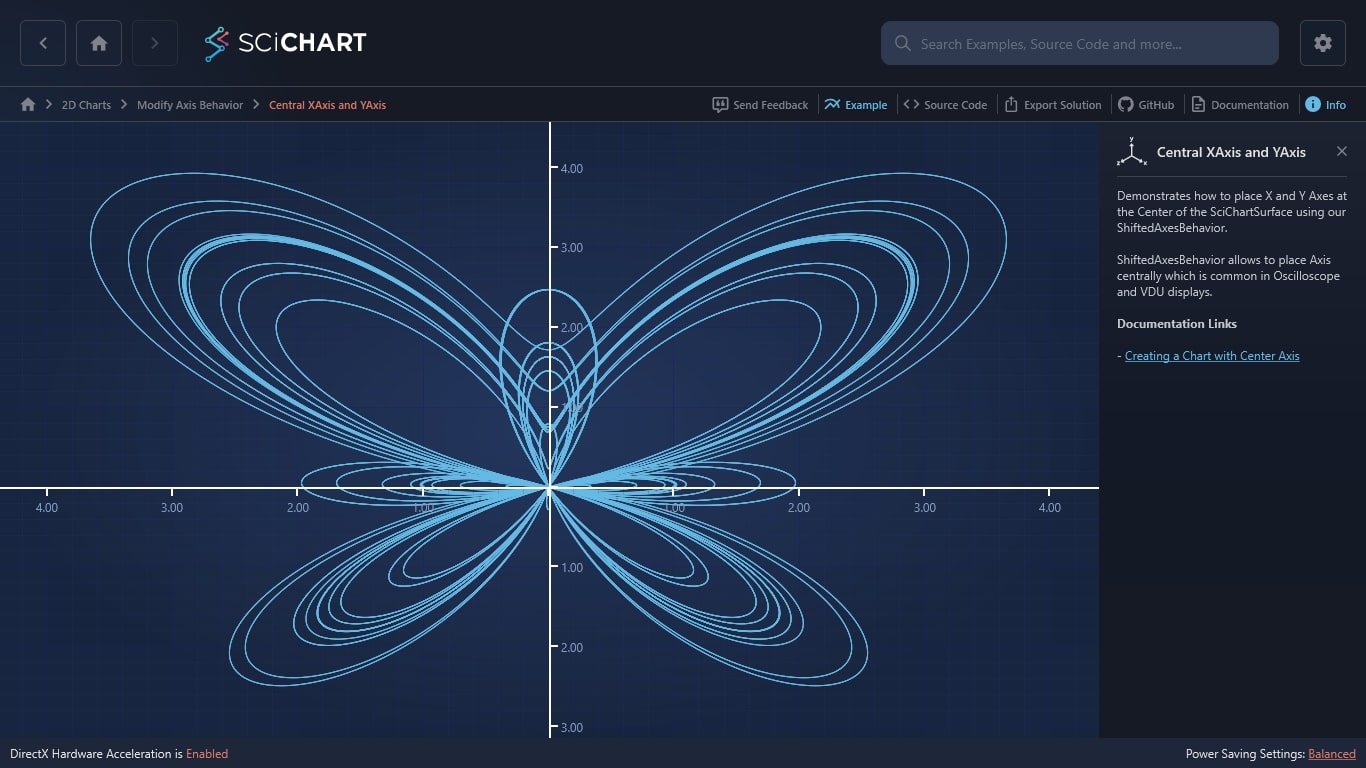
Demonstrates how to place X and Y Axes at the Center of the SciChartSurface using our ShiftedAxesBehavior.
ShiftedAxesBehavior allows to place Axis centrally which is common in Oscilloscope and VDU displays.
Documentation Links
– Creating a Chart with Center Axis

The C#/WPF source code for the WPF Chart Central XAxis and YAxis example is included below (Scroll down!).
Did you know you can also view the source code from one of the following sources as well?
- Clone the SciChart.WPF.Examples from Github.
- Or, view source in the SciChart WPF Examples suite.
- Also the SciChart WPF Trial contains the full source for the examples (link below).
ShiftedAxes.xaml
View source code<UserControl x:Class="SciChart.Examples.Examples.ModifyAxisBehaviour.ShiftedAxes.ShiftedAxes"
xmlns="http://schemas.microsoft.com/winfx/2006/xaml/presentation"
xmlns:x="http://schemas.microsoft.com/winfx/2006/xaml"
xmlns:d="http://schemas.microsoft.com/expression/blend/2008"
xmlns:i="http://schemas.microsoft.com/xaml/behaviors"
xmlns:mc="http://schemas.openxmlformats.org/markup-compatibility/2006"
xmlns:s="http://schemas.abtsoftware.co.uk/scichart"
xmlns:shiftedAxes="clr-namespace:SciChart.Examples.Examples.ModifyAxisBehaviour.ShiftedAxes"
Loaded="ShiftedAxes_OnLoaded"
d:DesignHeight="400"
d:DesignWidth="600"
mc:Ignorable="d">
<UserControl.Resources>
<ItemsPanelTemplate x:Key="template">
<Canvas s:ClipToBoundsHelper.ClipToBounds="True" />
</ItemsPanelTemplate>
<Style TargetType="s:NumericAxis">
<Setter Property="GrowBy" Value="0.1, 0.1" />
<Setter Property="TextFormatting" Value="0.00;0.00; " />
<Setter Property="BorderBrush" Value="#FFFFFFFF" />
<Setter Property="MajorTickLineStyle">
<Setter.Value>
<Style TargetType="Line">
<Setter Property="Stroke" Value="#FFFFFFFF" />
<Setter Property="StrokeThickness" Value="2" />
<Setter Property="StrokeEndLineCap" Value="Square" />
<Setter Property="X2" Value="6" />
<Setter Property="Y2" Value="6" />
</Style>
</Setter.Value>
</Setter>
</Style>
</UserControl.Resources>
<Grid>
<Grid.RowDefinitions>
<RowDefinition Height="Auto" />
<RowDefinition Height="*" />
</Grid.RowDefinitions>
<!-- Create the chart surface -->
<s:SciChartSurface x:Name="sciChart"
Grid.Row="1"
CenterXAxesPanelTemplate="{StaticResource template}"
CenterYAxesPanelTemplate="{StaticResource template}">
<i:Interaction.Behaviors>
<shiftedAxes:ShiftedAxesBehavior XAxisPosition="0"
XMode="Absolute"
YAxisPosition="0"
YMode="Absolute" />
</i:Interaction.Behaviors>
<!-- Declare RenderableSeries -->
<s:SciChartSurface.RenderableSeries>
<s:FastLineRenderableSeries x:Name="lineRenderSeries" StrokeThickness="1">
<s:FastLineRenderableSeries.SeriesAnimation>
<s:WaveAnimation AnimationDelay="0:0:1" Duration="0:0:3" PointDurationFraction="0.4"/>
</s:FastLineRenderableSeries.SeriesAnimation>
</s:FastLineRenderableSeries>
</s:SciChartSurface.RenderableSeries>
<!-- Create an X Axis with Growby -->
<s:SciChartSurface.XAxis>
<s:NumericAxis MinHeight="40"
BorderThickness="0,2,0,0"
IsCenterAxis="True" />
</s:SciChartSurface.XAxis>
<!-- Create a Y Axis with Growby. Optional bands give a cool look and feel for minimal performance impact -->
<s:SciChartSurface.YAxis>
<s:NumericAxis MinWidth="40"
BorderThickness="2,0,0,0"
IsCenterAxis="True" />
</s:SciChartSurface.YAxis>
<s:SciChartSurface.ChartModifier>
<s:ModifierGroup>
<s:ZoomExtentsModifier />
<s:MouseWheelZoomModifier />
</s:ModifierGroup>
</s:SciChartSurface.ChartModifier>
</s:SciChartSurface>
</Grid>
</UserControl>ShiftedAxes.xaml.cs
View source code// *************************************************************************************
// SCICHART® Copyright SciChart Ltd. 2011-2022. All rights reserved.
//
// Web: http://www.scichart.com
// Support: support@scichart.com
// Sales: sales@scichart.com
//
// ShiftedAxes.xaml.cs is part of the SCICHART® Examples. Permission is hereby granted
// to modify, create derivative works, distribute and publish any part of this source
// code whether for commercial, private or personal use.
//
// The SCICHART® examples are distributed in the hope that they will be useful, but
// without any warranty. It is provided "AS IS" without warranty of any kind, either
// expressed or implied.
// *************************************************************************************
using System;
using System.Windows;
using SciChart.Charting.Model.DataSeries;
using SciChart.Examples.ExternalDependencies.Data;
namespace SciChart.Examples.Examples.ModifyAxisBehaviour.ShiftedAxes
{
public partial class ShiftedAxes
{
public ShiftedAxes()
{
InitializeComponent();
}
private void ShiftedAxes_OnLoaded(object sender, RoutedEventArgs e)
{
using (sciChart.SuspendUpdates())
{
var dataSeries = new XyDataSeries<double, double> {AcceptsUnsortedData = true};
lineRenderSeries.DataSeries = dataSeries;
var data = DataManager.Instance.GetButterflyCurve(20000);
dataSeries.Append(data.XData, data.YData);
}
// To provide correct appearance of chart in Silverlight
// we use Dispatcher to delay ZoomExtents call on chart
Dispatcher.BeginInvoke(new Action(() => sciChart.ZoomExtents()));
}
}
}ShiftedAxesBehavior.cs
View source code