WPF Chart - Examples
SciChart WPF ships with hundreds of WPF Chart Examples which you can browse, play with, view the source-code and even export each WPF Chart Example to a stand-alone Visual Studio solution. All of this is possible with the new and improved SciChart WPF Examples Suite, which ships as part of the SciChart WPF SDK.
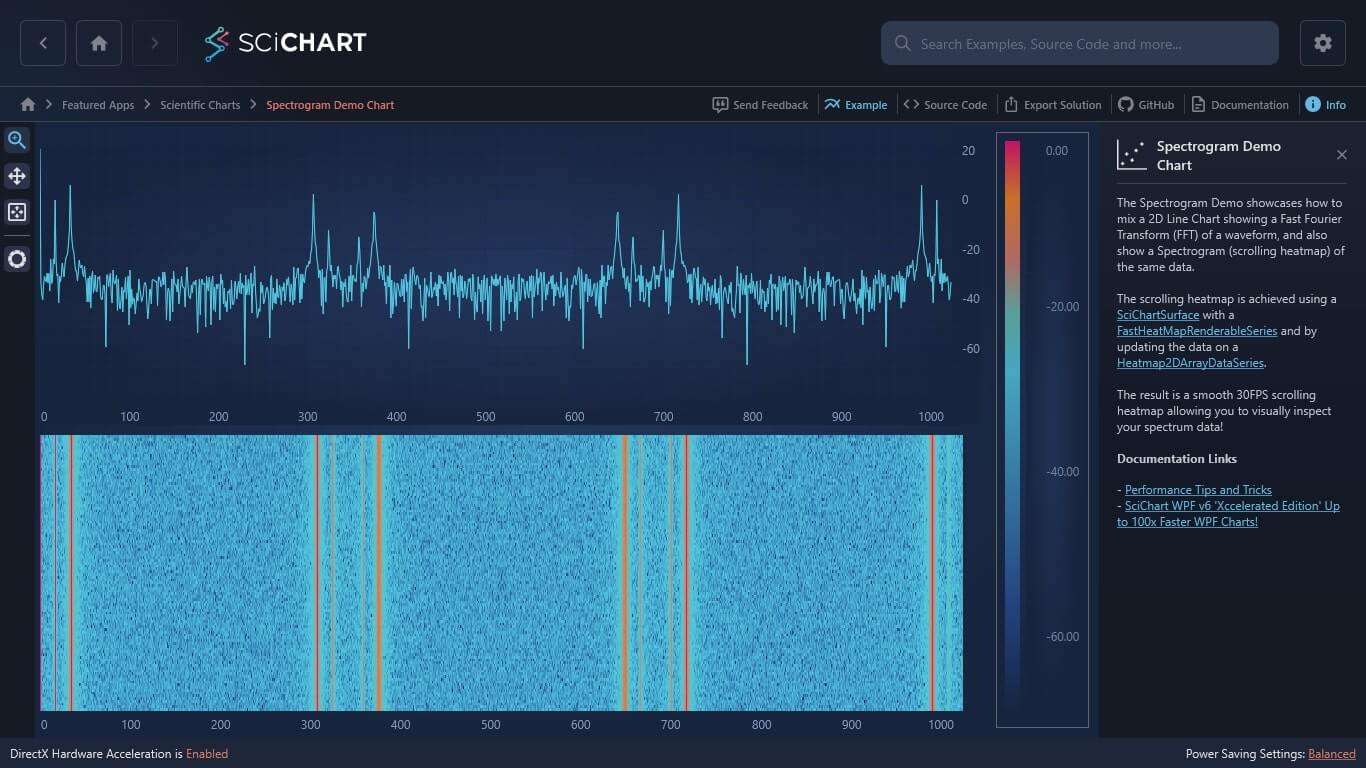
The Spectrogram Demo showcases how to mix a 2D Line Chart showing a Fast Fourier Transform (FFT) of a waveform, and also show a Spectrogram (scrolling heatmap) of the same data.
The scrolling heatmap is achieved using a SciChartSurface with a FastUniformHeatmapRenderableSeries and by updating the data on a UniformHeatmapDataSeries.
The result is a smooth 30FPS scrolling heatmap allowing you to visually inspect your spectrum data!
Documentation Links
– Performance Tips and Tricks
– SciChart WPF v6 ‘Xccelerated Edition’ Up to 100x Faster WPF Charts!

The C#/WPF source code for the WPF Chart Realtime Spectrogram Demo example is included below (Scroll down!).
Did you know you can also view the source code from one of the following sources as well?
- Clone the SciChart.WPF.Examples from Github.
- Or, view source in the SciChart WPF Examples suite.
- Also the SciChart WPF Trial contains the full source for the examples (link below).
SpectrogramDemoView.xaml
View source code<UserControl x:Class="SciChart.Examples.Examples.SeeFeaturedApplication.Spectrogram.SpectrogramDemoView"
xmlns="http://schemas.microsoft.com/winfx/2006/xaml/presentation"
xmlns:x="http://schemas.microsoft.com/winfx/2006/xaml"
xmlns:d="http://schemas.microsoft.com/expression/blend/2008"
xmlns:ext="http://schemas.abtsoftware.co.uk/scichart/exampleExternals"
xmlns:mc="http://schemas.openxmlformats.org/markup-compatibility/2006"
xmlns:s="http://schemas.abtsoftware.co.uk/scichart"
Loaded="OnExampleLoaded"
Unloaded="OnExampleUnloaded"
d:DesignHeight="400"
d:DesignWidth="600"
mc:Ignorable="d">
<UserControl.Resources>
<ResourceDictionary>
<ResourceDictionary.MergedDictionaries>
<ResourceDictionary Source="/SciChart.Examples.ExternalDependencies;component/Resources/Styles/ToolbarButtonsCommon.xaml" />
</ResourceDictionary.MergedDictionaries>
<ext:BoolToValueConverter x:Key="BoolToVisibilityConverter" FalseValue="Collapsed" TrueValue="Visible" />
<s:GradientStopsToLinearGradientBrushConverter x:Key="ColorsToLineatGradientBrushConverter"/>
<Style x:Key="AxisStyle" TargetType="s:AxisBase">
<Setter Property="DrawMajorBands" Value="False" />
<Setter Property="IsPrimaryAxis" Value="False" />
<Setter Property="AxisBandsFill" Value="Transparent" />
<Setter Property="DrawMajorGridLines" Value="false" />
<Setter Property="DrawMinorGridLines" Value="false" />
<Setter Property="MajorTickLineStyle">
<Setter.Value>
<Style TargetType="Line">
<Setter Property="Stroke" Value="Transparent" />
</Style>
</Setter.Value>
</Setter>
<Setter Property="MinorTickLineStyle">
<Setter.Value>
<Style TargetType="Line">
<Setter Property="Stroke" Value="Transparent" />
</Style>
</Setter.Value>
</Setter>
</Style>
</ResourceDictionary>
</UserControl.Resources>
<Grid Background="#FF1C1C1E">
<Grid.ColumnDefinitions>
<ColumnDefinition Width="Auto" />
<ColumnDefinition Width="*" />
<ColumnDefinition Width="Auto" />
</Grid.ColumnDefinitions>
<Grid.RowDefinitions>
<RowDefinition Height="*"/>
<RowDefinition Height="*"/>
</Grid.RowDefinitions>
<!-- The SciChartInteractionToolbar adds zoom, pan, zoom extents and rotate functionality -->
<!-- to the chart and is included for example purposes. -->
<!-- If you wish to know how to zoom and pan a chart then do a search for Zoom Pan in the Examples suite! -->
<ext:SciChartInteractionToolbar Grid.RowSpan="2" TargetSurface="{Binding Source={x:Reference Name=sciChart}}"/>
<s:SciChartSurface x:Name="sciChart"
Grid.Column="1"
Margin="5">
<s:SciChartSurface.RenderableSeries>
<s:FastLineRenderableSeries x:Name="LineRenderableSeries" Stroke="#279B27" />
</s:SciChartSurface.RenderableSeries>
<s:SciChartSurface.XAxis>
<s:NumericAxis />
</s:SciChartSurface.XAxis>
<s:SciChartSurface.YAxis>
<s:NumericAxis GrowBy="0.1, 0.1" />
</s:SciChartSurface.YAxis>
</s:SciChartSurface>
<s:HeatmapColorMap Grid.RowSpan="2"
Grid.Column="2"
Margin="10"
HorizontalAlignment="Right"
VerticalAlignment="Stretch"
Background="{Binding Source={x:Reference Name=sciChart}, Path=Background}"
BorderBrush="#777"
BorderThickness="1"
ColorMap="{Binding Source={x:Reference Name=HeatmapRenderableSeries}, Path=ColorMap.GradientStops, Converter={StaticResource ColorsToLineatGradientBrushConverter}}"
Foreground="{Binding Source={x:Reference Name=sciChart}, Path=Foreground}"
Maximum="{Binding Source={x:Reference Name=HeatmapRenderableSeries}, Path=ColorMap.Maximum}"
Minimum="{Binding Source={x:Reference Name=HeatmapRenderableSeries}, Path=ColorMap.Minimum}"
Opacity="0.8"
Orientation="Vertical"
TextFormatting="0.00"/>
<s:SciChartSurface x:Name="sciChart2"
Grid.Row="1"
Grid.Column="1"
Margin="5 5 20 5">
<s:SciChartSurface.RenderableSeries>
<s:FastUniformHeatmapRenderableSeries x:Name="HeatmapRenderableSeries" AutoPeakDetection="True">
<s:FastUniformHeatmapRenderableSeries.ColorMap>
<s:HeatmapColorPalette Minimum="-70" Maximum="0">
<s:HeatmapColorPalette.GradientStops>
<GradientStop Offset="0" Color="Transparent" />
<GradientStop Offset="0.0001" Color="DarkBlue" />
<GradientStop Offset="0.2" Color="CornflowerBlue" />
<GradientStop Offset="0.4" Color="DarkGreen" />
<GradientStop Offset="0.6" Color="Chartreuse" />
<GradientStop Offset="0.8" Color="Yellow" />
<GradientStop Offset="1" Color="Red" />
</s:HeatmapColorPalette.GradientStops>
</s:HeatmapColorPalette>
</s:FastUniformHeatmapRenderableSeries.ColorMap>
</s:FastUniformHeatmapRenderableSeries>
</s:SciChartSurface.RenderableSeries>
<s:SciChartSurface.XAxis>
<s:NumericAxis Style="{StaticResource AxisStyle}" VisibleRange="{Binding Source={x:Reference Name=sciChart}, Path=XAxis.VisibleRange, Mode=TwoWay}" />
</s:SciChartSurface.XAxis>
<s:SciChartSurface.YAxis>
<s:NumericAxis Style="{StaticResource AxisStyle}" Visibility="Hidden" FlipCoordinates="True" />
</s:SciChartSurface.YAxis>
</s:SciChartSurface>
</Grid>
</UserControl>
SpectrogramDemoView.xaml.cs
View source code// *************************************************************************************
// SCICHART® Copyright SciChart Ltd. 2011-2022. All rights reserved.
//
// Web: http://www.scichart.com
// Support: support@scichart.com
// Sales: sales@scichart.com
//
// SpectrogramDemoView.xaml.cs is part of the SCICHART® Examples. Permission is hereby granted
// to modify, create derivative works, distribute and publish any part of this source
// code whether for commercial, private or personal use.
//
// The SCICHART® examples are distributed in the hope that they will be useful, but
// without any warranty. It is provided "AS IS" without warranty of any kind, either
// expressed or implied.
// *************************************************************************************
using System;
using System.Windows;
using System.Windows.Controls;
using System.Windows.Threading;
using SciChart.Charting.Model.DataSeries;
using SciChart.Charting.Model.DataSeries.Heatmap2DArrayDataSeries;
using SciChart.Examples.ExternalDependencies.Data;
namespace SciChart.Examples.Examples.SeeFeaturedApplication.Spectrogram
{
/// <summary>
/// Interaction logic for SpectrogramDemoView.xaml
/// </summary>
public partial class SpectrogramDemoView : UserControl
{
private readonly DispatcherTimer _timer;
private readonly XyDataSeries<double, double> _xyDataSeries = new XyDataSeries<double>();
private readonly Random _random = new Random();
private readonly FFT2 _transform;
private readonly object _tickLocker = new object();
private readonly double[] _re = new double[1024];
private readonly double[] _im = new double[1024];
private readonly double[,] _spectrogramBuffer = new double[100, 1024];
private readonly double[,] _pastFrame = new double[100, 1024];
private readonly IDataSeries _uniformHeatmapDataSeries;
public SpectrogramDemoView()
{
InitializeComponent();
_transform = new FFT2();
_transform.init(10);
_uniformHeatmapDataSeries = new UniformHeatmapDataSeries<int, int, double>(_spectrogramBuffer, 0, 1, 0, 1);
FirstCreateSeries();
LineRenderableSeries.DataSeries = _xyDataSeries;
HeatmapRenderableSeries.DataSeries = _uniformHeatmapDataSeries;
UpdateDataOnTimerTick();
_timer = new DispatcherTimer(DispatcherPriority.Render)
{
Interval = TimeSpan.FromMilliseconds(10),
IsEnabled = true
};
_timer.Tick += TimerOnTick;
}
private void OnExampleLoaded(object sender, RoutedEventArgs e)
{
_timer.Start();
}
private void OnExampleUnloaded(object sender, RoutedEventArgs e)
{
_timer.Stop();
}
private void TimerOnTick(object sender, EventArgs e)
{
UpdateDataOnTimerTick();
}
private void FirstCreateSeries()
{
for (int x = 0; x < 100; x++)
{
UpdateXyDataSeries();
for (int y = 0; y < 1024; y++)
_pastFrame[x, y] = _xyDataSeries.YValues[y];
}
}
private void UpdateDataOnTimerTick()
{
using (_xyDataSeries.SuspendUpdates())
{
UpdateXyDataSeries();
UpdateSpectrogramHeatmapSeries(_xyDataSeries);
}
}
private void UpdateSpectrogramHeatmapSeries(XyDataSeries<double,double> series)
{
// Compute the new spectrogram frame
for (int x = 99; x >= 0; x--)
for (int y = 0; y < 1024; y++)
_spectrogramBuffer[x, y] = (x == 99) ? series.YValues[y] : _pastFrame[x + 1, y];
// Preserve the past frame, as current spectrogram is computed based on last + Xy fft values
Array.Copy(_spectrogramBuffer, _pastFrame, _spectrogramBuffer.Length);
// Forces Heatmap to redraw after updating values
_uniformHeatmapDataSeries.InvalidateParentSurface(RangeMode.None);
}
private void UpdateXyDataSeries()
{
lock (_tickLocker)
{
for (int i = 0; i < 1024; i++)
{
_re[i] = 2.0 * Math.Sin(2 * Math.PI * i / 20) +
5 * Math.Sin(2 * Math.PI * i / 10) +
2.0 * _random.NextDouble();
_im[i] = -10;
}
_transform.run(_re, _im);
for (int i = 0; i < 1024; i++)
{
double mag = Math.Sqrt(_re[i] * _re[i] + _im[i] * _im[i]);
_re[i] = 20 * Math.Log10(mag / 1024);
_im[i] = i;
}
_xyDataSeries.Clear();
_xyDataSeries.Append(_im, _re);
}
}
}
}