WPF Chart - Examples
SciChart WPF ships with hundreds of WPF Chart Examples which you can browse, play with, view the source-code and even export each WPF Chart Example to a stand-alone Visual Studio solution. All of this is possible with the new and improved SciChart WPF Examples Suite, which ships as part of the SciChart WPF SDK.
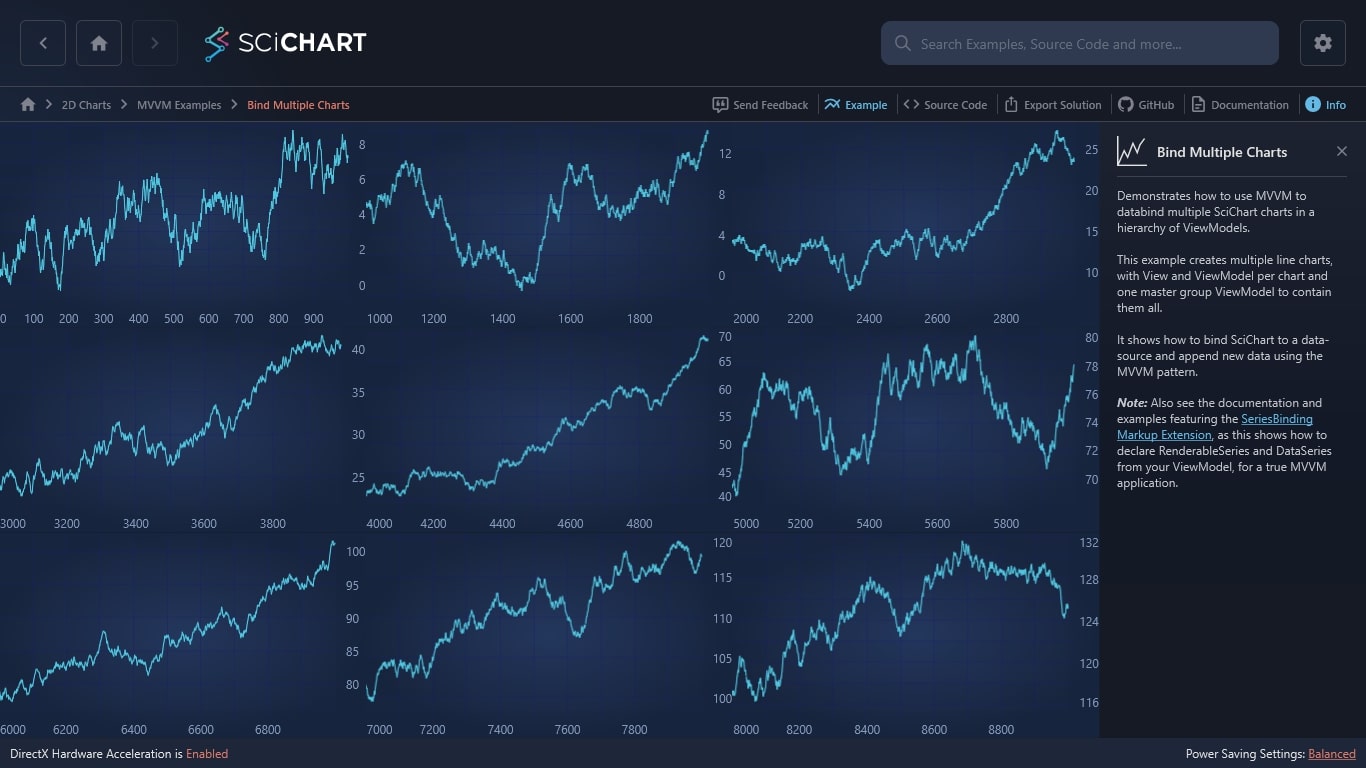
Demonstrates how to use MVVM to databind multiple SciChart charts in a hierarchy of ViewModels.
This example creates multiple line charts, with View and ViewModel per chart and one master group ViewModel to contain them all.
It shows how to bind SciChart to a data-source and append new data using the MVVM pattern.
Note: Also see the documentation and examples featuring the SeriesBinding Markup Extension, as this shows how to declare RenderableSeries and DataSeries from your ViewModel, for a true MVVM application.

The C#/WPF source code for the WPF Chart Bind Multiple Charts MVVM example is included below (Scroll down!).
Did you know you can also view the source code from one of the following sources as well?
- Clone the SciChart.WPF.Examples from Github.
- Or, view source in the SciChart WPF Examples suite.
- Also the SciChart WPF Trial contains the full source for the examples (link below).
BindMultipleChartsGroupView.xaml
View source code<UserControl x:Class="SciChart.Examples.Examples.UseSciChartWithMvvm.BindMultipleCharts.BindMultipleChartsGroupView"
xmlns="http://schemas.microsoft.com/winfx/2006/xaml/presentation"
xmlns:x="http://schemas.microsoft.com/winfx/2006/xaml"
xmlns:d="http://schemas.microsoft.com/expression/blend/2008"
xmlns:local="clr-namespace:SciChart.Examples.Examples.UseSciChartWithMvvm.BindMultipleCharts"
xmlns:mc="http://schemas.openxmlformats.org/markup-compatibility/2006"
d:DesignHeight="400"
d:DesignWidth="600"
mc:Ignorable="d">
<!-- Create a grid with three rows, three columns -->
<Grid>
<Grid.RowDefinitions>
<RowDefinition Height="*" />
<RowDefinition Height="*" />
<RowDefinition Height="*" />
</Grid.RowDefinitions>
<Grid.ColumnDefinitions>
<ColumnDefinition Width="*" />
<ColumnDefinition Width="*" />
<ColumnDefinition Width="*" />
</Grid.ColumnDefinitions>
<!-- In the grid we create 9 ChartViews. Each ChartView has a single SciChartSurface internally and manages that -->
<!-- We bind the chart view's DataContext to a ChartViewModel created in MainViewModel -->
<!-- Therefore, there is a 1:1 binding between each ChartView and its associated ChartViewModel -->
<!-- First Row -->
<local:ChartView Grid.Row="0"
Grid.Column="0"
DataContext="{Binding ChartViewModels[0]}" />
<local:ChartView Grid.Row="0"
Grid.Column="1"
DataContext="{Binding ChartViewModels[1]}" />
<local:ChartView Grid.Row="0"
Grid.Column="2"
DataContext="{Binding ChartViewModels[2]}" />
<!-- Second Row -->
<local:ChartView Grid.Row="1"
Grid.Column="0"
DataContext="{Binding ChartViewModels[3]}" />
<local:ChartView Grid.Row="1"
Grid.Column="1"
DataContext="{Binding ChartViewModels[4]}" />
<local:ChartView Grid.Row="1"
Grid.Column="2"
DataContext="{Binding ChartViewModels[5]}" />
<!-- Third Row -->
<local:ChartView Grid.Row="2"
Grid.Column="0"
DataContext="{Binding ChartViewModels[6]}" />
<local:ChartView Grid.Row="2"
Grid.Column="1"
DataContext="{Binding ChartViewModels[7]}" />
<local:ChartView Grid.Row="2"
Grid.Column="2"
DataContext="{Binding ChartViewModels[8]}" />
</Grid>
</UserControl>
BindMultipleChartsGroupView.xaml.cs
View source code// *************************************************************************************
// SCICHART® Copyright SciChart Ltd. 2011-2022. All rights reserved.
//
// Web: http://www.scichart.com
// Support: support@scichart.com
// Sales: sales@scichart.com
//
// BindMultipleChartsGroupView.xaml.cs is part of the SCICHART® Examples. Permission is hereby granted
// to modify, create derivative works, distribute and publish any part of this source
// code whether for commercial, private or personal use.
//
// The SCICHART® examples are distributed in the hope that they will be useful, but
// without any warranty. It is provided "AS IS" without warranty of any kind, either
// expressed or implied.
// *************************************************************************************
using System.Windows.Controls;
namespace SciChart.Examples.Examples.UseSciChartWithMvvm.BindMultipleCharts
{
public partial class BindMultipleChartsGroupView : UserControl
{
public BindMultipleChartsGroupView()
{
InitializeComponent();
}
}
}
BindMultipleChartsGroupViewModel.cs
View source code// *************************************************************************************
// SCICHART® Copyright SciChart Ltd. 2011-2022. All rights reserved.
//
// Web: http://www.scichart.com
// Support: support@scichart.com
// Sales: sales@scichart.com
//
// BindMultipleChartsGroupViewModel.cs is part of the SCICHART® Examples. Permission is hereby granted
// to modify, create derivative works, distribute and publish any part of this source
// code whether for commercial, private or personal use.
//
// The SCICHART® examples are distributed in the hope that they will be useful, but
// without any warranty. It is provided "AS IS" without warranty of any kind, either
// expressed or implied.
// *************************************************************************************
using System.Collections.ObjectModel;
using SciChart.Charting.Model.DataSeries;
using SciChart.Examples.ExternalDependencies.Common;
using SciChart.Examples.ExternalDependencies.Data;
namespace SciChart.Examples.Examples.UseSciChartWithMvvm.BindMultipleCharts
{
public class BindMultipleChartsGroupViewModel : BaseViewModel
{
private readonly RandomWalkGenerator _dataSource = new RandomWalkGenerator();
// Expose N ChartViewModels for each ChartView to bind to
public ObservableCollection<ChartViewModel> ChartViewModels { get; } = new ObservableCollection<ChartViewModel>();
public BindMultipleChartsGroupViewModel()
{
// Instantiate 9 ChartViewModels
for (int i = 0; i < 9; i++)
{
// Create a ChartViewModel
var chartViewModel = new ChartViewModel();
// Create the data-series
var dataSeries = new UniformXyDataSeries<double>(i * 1000, 1d);
// Create data
var dummyYData = _dataSource.GetRandomWalkYData(1000);
// Append X,Y data
dataSeries.Append(dummyYData);
// Set the DataSeries on the ChartViewModel
chartViewModel.ChartData = dataSeries;
ChartViewModels.Add(chartViewModel);
}
}
}
}
ChartView.xaml
View source code<UserControl x:Class="SciChart.Examples.Examples.UseSciChartWithMvvm.BindMultipleCharts.ChartView"
xmlns="http://schemas.microsoft.com/winfx/2006/xaml/presentation"
xmlns:x="http://schemas.microsoft.com/winfx/2006/xaml"
xmlns:d="http://schemas.microsoft.com/expression/blend/2008"
xmlns:mc="http://schemas.openxmlformats.org/markup-compatibility/2006"
xmlns:s="http://schemas.abtsoftware.co.uk/scichart"
d:DesignHeight="400"
d:DesignWidth="600"
mc:Ignorable="d">
<!-- Declare a SciChartSurface and bind to ChartData -->
<s:SciChartSurface>
<s:SciChartSurface.RenderableSeries>
<s:FastLineRenderableSeries DataSeries="{Binding ChartData}" Stroke="SteelBlue" />
</s:SciChartSurface.RenderableSeries>
<s:SciChartSurface.YAxis>
<s:NumericAxis AutoRange="{Binding AutoRange,
Mode=TwoWay}"
DrawMinorGridLines="False"
DrawMinorTicks="False">
<s:NumericAxis.GrowBy>
<s:DoubleRange Max="0.05" Min="0.05" />
</s:NumericAxis.GrowBy>
</s:NumericAxis>
</s:SciChartSurface.YAxis>
<s:SciChartSurface.XAxis>
<s:NumericAxis AutoRange="{Binding AutoRange,
Mode=TwoWay}"
DrawMinorGridLines="False"
DrawMinorTicks="False" />
</s:SciChartSurface.XAxis>
<s:SciChartSurface.ChartModifier>
<s:ModifierGroup>
<s:RubberBandXyZoomModifier />
<s:ZoomExtentsModifier ExecuteOn="MouseDoubleClick" />
</s:ModifierGroup>
</s:SciChartSurface.ChartModifier>
</s:SciChartSurface>
</UserControl>
ChartView.xaml.cs
View source code// *************************************************************************************
// SCICHART® Copyright SciChart Ltd. 2011-2022. All rights reserved.
//
// Web: http://www.scichart.com
// Support: support@scichart.com
// Sales: sales@scichart.com
//
// ChartView.xaml.cs is part of the SCICHART® Examples. Permission is hereby granted
// to modify, create derivative works, distribute and publish any part of this source
// code whether for commercial, private or personal use.
//
// The SCICHART® examples are distributed in the hope that they will be useful, but
// without any warranty. It is provided "AS IS" without warranty of any kind, either
// expressed or implied.
// *************************************************************************************
using System.Windows.Controls;
namespace SciChart.Examples.Examples.UseSciChartWithMvvm.BindMultipleCharts
{
public partial class ChartView : UserControl
{
public ChartView()
{
InitializeComponent();
}
}
}
ChartViewModel.cs
View source code// *************************************************************************************
// SCICHART® Copyright SciChart Ltd. 2011-2022. All rights reserved.
//
// Web: http://www.scichart.com
// Support: support@scichart.com
// Sales: sales@scichart.com
//
// ChartViewModel.cs is part of the SCICHART® Examples. Permission is hereby granted
// to modify, create derivative works, distribute and publish any part of this source
// code whether for commercial, private or personal use.
//
// The SCICHART® examples are distributed in the hope that they will be useful, but
// without any warranty. It is provided "AS IS" without warranty of any kind, either
// expressed or implied.
// *************************************************************************************
using SciChart.Charting.Model.DataSeries;
using SciChart.Charting.Visuals.Axes;
using SciChart.Examples.ExternalDependencies.Common;
namespace SciChart.Examples.Examples.UseSciChartWithMvvm.BindMultipleCharts
{
public class ChartViewModel : BaseViewModel
{
private IDataSeries _chartData;
private AutoRange _AutoRange;
public IDataSeries ChartData
{
get { return _chartData; }
set
{
_chartData = value;
OnPropertyChanged("ChartData");
}
}
public AutoRange AutoRange
{
get { return _AutoRange; }
set
{
_AutoRange = value;
OnPropertyChanged("AutoRange");
}
}
}
}
