WPF Chart - Examples
SciChart WPF ships with hundreds of WPF Chart Examples which you can browse, play with, view the source-code and even export each WPF Chart Example to a stand-alone Visual Studio solution. All of this is possible with the new and improved SciChart WPF Examples Suite, which ships as part of the SciChart WPF SDK.
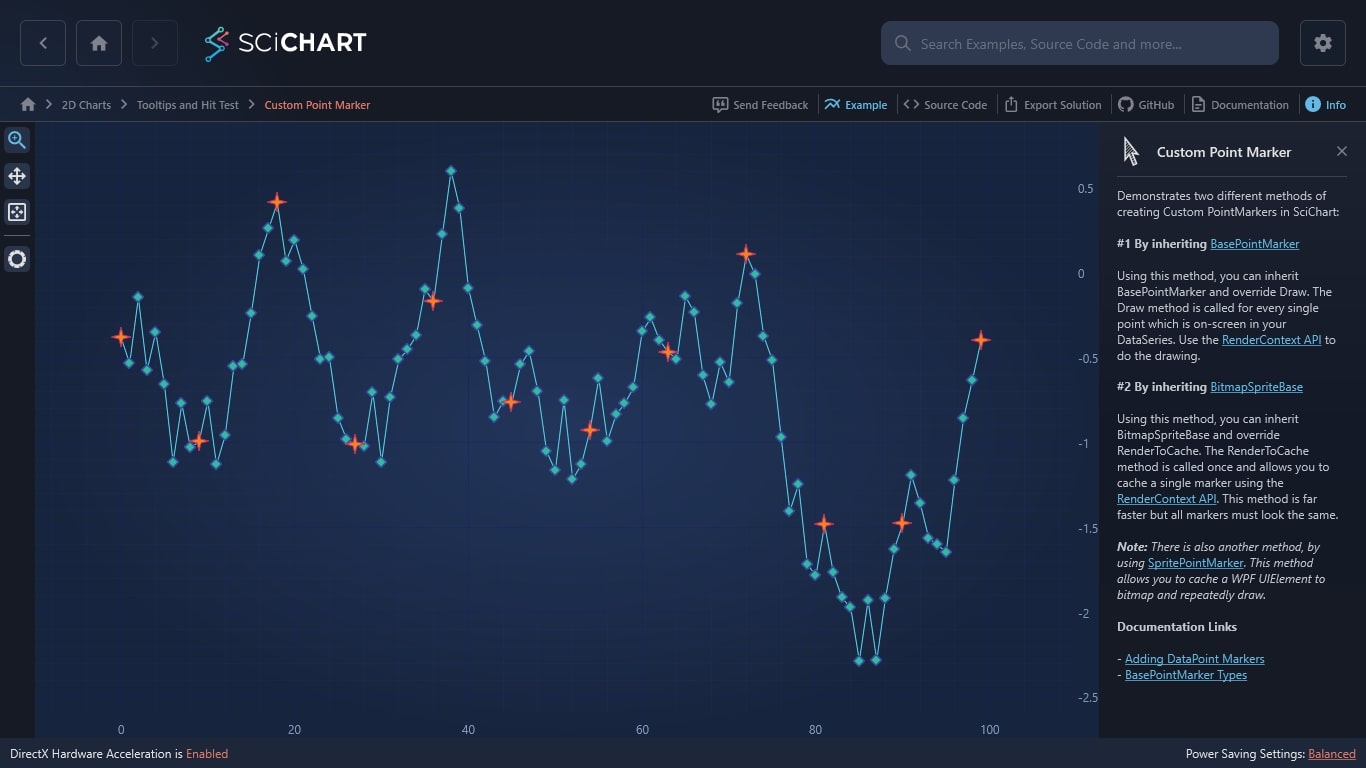
Demonstrates two different methods of creating Custom PointMarkers in SciChart:
#1 By inheriting BasePointMarker
Using this method, you can inherit BasePointMarker and override Draw. The Draw method is called for every single point which is on-screen in your DataSeries. Use the RenderContext API to do the drawing.
#2 By inheriting BitmapSpriteBase
Using this method, you can inherit BitmapSpriteBase and override RenderToCache. The RenderToCache method is called once and allows you to cache a single marker using the RenderContext API. This method is far faster but all markers must look the same.
Note: There is also another method, by using SpritePointMarker. This method allows you to cache a WPF UIElement to bitmap and repeatedly draw.
Documentation Links

The C#/WPF source code for the WPF Chart Custom Point Marker example is included below (Scroll down!).
Did you know you can also view the source code from one of the following sources as well?
- Clone the SciChart.WPF.Examples from Github.
- Or, view source in the SciChart WPF Examples suite.
- Also the SciChart WPF Trial contains the full source for the examples (link below).
CustomPointMarker.xaml
View source code<UserControl x:Class="SciChart.Examples.Examples.InspectDatapoints.CustomPointMarker.CustomPointMarker"
xmlns="http://schemas.microsoft.com/winfx/2006/xaml/presentation"
xmlns:x="http://schemas.microsoft.com/winfx/2006/xaml"
xmlns:pointMarker="clr-namespace:SciChart.Examples.Examples.InspectDatapoints.CustomPointMarker"
xmlns:d="http://schemas.microsoft.com/expression/blend/2008"
xmlns:mc="http://schemas.openxmlformats.org/markup-compatibility/2006"
xmlns:s="http://schemas.abtsoftware.co.uk/scichart"
xmlns:ext="http://schemas.abtsoftware.co.uk/scichart/exampleExternals"
d:DesignHeight="400"
d:DesignWidth="600"
mc:Ignorable="d">
<UserControl.Resources>
<pointMarker:StarPointMarker x:Key="StarPointMarker"
Width="20"
Height="20"
Fill="Blue"
Stroke="Yellow"
StrokeThickness="1" />
</UserControl.Resources>
<Grid>
<Grid.ColumnDefinitions>
<ColumnDefinition Width="Auto" />
<ColumnDefinition Width="*" />
</Grid.ColumnDefinitions>
<ext:SciChartInteractionToolbar TargetSurface="{Binding Source={x:Reference Name=sciChart}}" />
<s:SciChartSurface Grid.Column="1" Name="sciChart">
<!-- Declare line RenderableSeries with PointMarker -->
<s:SciChartSurface.RenderableSeries>
<s:FastLineRenderableSeries x:Name="fastLineSeries"
SelectedPointMarker="{StaticResource StarPointMarker}"
Stroke="#FFFF1919">
<s:FastLineRenderableSeries.PointMarker>
<pointMarker:DiamondPointMarker Width="11"
Height="11"
Fill="Yellow"
Stroke="Red"
StrokeThickness="2" />
</s:FastLineRenderableSeries.PointMarker>
<s:FastLineRenderableSeries.SeriesAnimation>
<s:FadeAnimation AnimationDelay="0:0:1" Duration="0:0:3"/>
</s:FastLineRenderableSeries.SeriesAnimation>
</s:FastLineRenderableSeries>
</s:SciChartSurface.RenderableSeries>
<!-- Create an X Axis with Growby -->
<s:SciChartSurface.XAxis>
<s:NumericAxis DrawMajorBands="False" GrowBy="0.1, 0.1" />
</s:SciChartSurface.XAxis>
<!-- Create a Y Axis with Growby. Optional bands give a cool look and feel for minimal performance impact -->
<s:SciChartSurface.YAxis>
<s:NumericAxis DrawMajorBands="False" GrowBy="0.1, 0.1" />
</s:SciChartSurface.YAxis>
<!-- Create Modifiers -->
<s:SciChartSurface.ChartModifier>
<s:ModifierGroup>
<s:RubberBandXyZoomModifier />
<s:MouseWheelZoomModifier />
<s:ZoomExtentsModifier />
<s:XAxisDragModifier />
<s:YAxisDragModifier />
</s:ModifierGroup>
</s:SciChartSurface.ChartModifier>
</s:SciChartSurface>
</Grid>
</UserControl>
CustomPointMarker.xaml.cs
View source code// *************************************************************************************
// SCICHART® Copyright SciChart Ltd. 2011-2022. All rights reserved.
//
// Web: http://www.scichart.com
// Support: support@scichart.com
// Sales: sales@scichart.com
//
// CustomPointMarker.xaml.cs is part of the SCICHART® Examples. Permission is hereby granted
// to modify, create derivative works, distribute and publish any part of this source
// code whether for commercial, private or personal use.
//
// The SCICHART® examples are distributed in the hope that they will be useful, but
// without any warranty. It is provided "AS IS" without warranty of any kind, either
// expressed or implied.
// *************************************************************************************
using System.Collections.Generic;
using System.Windows.Controls;
using SciChart.Charting.Model.DataSeries;
using SciChart.Examples.ExternalDependencies.Data;
namespace SciChart.Examples.Examples.InspectDatapoints.CustomPointMarker
{
/// <summary>
/// Interaction logic for CustomPointMarker.xaml
/// </summary>
public partial class CustomPointMarker : UserControl
{
private readonly RandomWalkGenerator _dataSource;
public CustomPointMarker()
{
InitializeComponent();
var count = 100;
// Create a DataSeriesSet
var dataSeries = new UniformXyDataSeries<double>();
// Create a single data-series
_dataSource = new RandomWalkGenerator();
// Create a single metadata
IList<IPointMetadata> metadata = new List<IPointMetadata>();
for (int i = 0; i < 100; ++i)
{
IPointMetadata pointMetadata = new SelectedPointMetadata();
if (i % 9 == 0)
{
pointMetadata.IsSelected = true;
}
metadata.Add(pointMetadata);
}
// Append data to series.
dataSeries.Append(_dataSource.GetRandomWalkYData(count), metadata);
fastLineSeries.DataSeries = dataSeries;
}
}
public class SelectedPointMetadata : IPointMetadata
{
public bool IsSelected { get; set; }
public event System.ComponentModel.PropertyChangedEventHandler PropertyChanged;
}
}DiamondPointMarker.cs
View source code// *************************************************************************************
// SCICHART® Copyright SciChart Ltd. 2011-2022. All rights reserved.
//
// Web: http://www.scichart.com
// Support: support@scichart.com
// Sales: sales@scichart.com
//
// DiamondPointMarker.cs is part of the SCICHART® Examples. Permission is hereby granted
// to modify, create derivative works, distribute and publish any part of this source
// code whether for commercial, private or personal use.
//
// The SCICHART® examples are distributed in the hope that they will be useful, but
// without any warranty. It is provided "AS IS" without warranty of any kind, either
// expressed or implied.
// *************************************************************************************
using System.Collections.Generic;
using System.Windows;
using SciChart.Charting.Visuals.PointMarkers;
using SciChart.Drawing.Common;
namespace SciChart.Examples.Examples.InspectDatapoints.CustomPointMarker
{
public class DiamondPointMarker : BasePointMarker
{
public override void Draw(IRenderContext2D context, IEnumerable<Point> centers)
{
var fill = context.CreateBrush(Fill);
var stroke = context.CreatePen(Stroke, AntiAliasing, (float)StrokeThickness);
float width2 = (float)(Width * 0.5);
float height2 = (float)(Height * 0.5);
foreach (var center in centers)
{
double top = center.Y - height2;
double bottom = center.Y + height2;
double left = center.X - width2;
double right = center.X + width2;
var diamondPoints = new[]
{
// Points drawn like this:
//
// x0 (x4 in same location as x0)
//
// x3 x1
//
// x2
new Point(center.X, top), // x0
new Point(right, center.Y), // x1
new Point(center.X, bottom), // x2
new Point(left, center.Y), // x3
new Point(center.X, top), // x4 == x0
};
context.FillPolygon(fill, diamondPoints);
context.DrawLines(stroke, diamondPoints);
}
}
}
}
StarPointMarker.cs
View source code// *************************************************************************************
// SCICHART® Copyright SciChart Ltd. 2011-2022. All rights reserved.
//
// Web: http://www.scichart.com
// Support: support@scichart.com
// Sales: sales@scichart.com
//
// StarPointMarker.cs is part of the SCICHART® Examples. Permission is hereby granted
// to modify, create derivative works, distribute and publish any part of this source
// code whether for commercial, private or personal use.
//
// The SCICHART® examples are distributed in the hope that they will be useful, but
// without any warranty. It is provided "AS IS" without warranty of any kind, either
// expressed or implied.
// *************************************************************************************
using System.Windows;
using SciChart.Charting.Visuals.PointMarkers;
using SciChart.Drawing.Common;
namespace SciChart.Examples.Examples.InspectDatapoints.CustomPointMarker
{
public class StarPointMarker : BitmapSpriteBase
{
protected override void RenderToCache(IRenderContext2D context, IPen2D strokePen, IBrush2D fillBrush)
{
var offset = 2d;
var polygon = new Point[] {new Point(Width/2, 0), new Point(Width/2 + offset, Height/2 - offset), new Point(Width, Height/2), new Point(Width/2 + offset, Height/2 + offset), new Point(Width/2, Height), new Point(Width/2-offset, Height/2+offset), new Point(0, Height/2), new Point(Width/2-offset, Height/2-offset), new Point(Width/2, 0)};
context.FillPolygon(fillBrush, polygon);
context.DrawLines(strokePen, polygon);
}
}
}
