
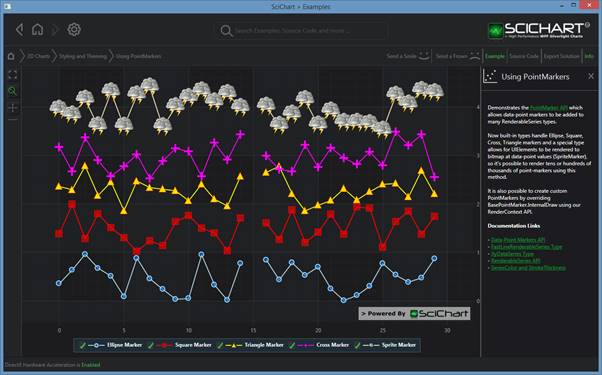
SciChart features a rich PointMarkers API to annotate the data-points of certain series with markers, e.g. Ellipse, Square, Triangle, Cross or custom (UIElement) marker. The following sections detail how to add PointMarkers to your SciChart charting application from a visual perspective.
NOTE: that like RenderableSeries, PointMarkers are derived from ContentControl and included in the Visual Tree so that RelativeSource binding works, however they are not rendered using the WPF Composition engine, but instead an alternative Bitmap-based engine. This means that PointMarkers are rendered very fast, hundreds of thousands or even millions of markers are not a problem, but don’t expect to put a DataTemplate on it and get Mouse-Over events! To handle these use cases we have a separate Hit-Test API.
EllipsePointMarker
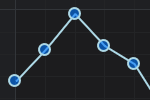 To add an EllipsePointMarker to a RenderableSeries, use the following syntax. This will cause a 7-pixel diameter circle to be rendered at each data-point on the parent FastLineRenderableSeries. Note that Stroke and Fill may be Transparent if desired.
XAML
| EllipsePointMarker |
Copy Code |
|---|---|
<!-- where xmlns:s="http://schemas.abtsoftware.co.uk/scichart" --> <s:SciChartSurface.RenderableSeries> <s:FastLineRenderableSeries Stroke="White"> <s:FastLineRenderableSeries.PointMarker> <s:EllipsePointMarker Fill="LightSteelBlue" Stroke="White" Width="7" Height="7" StrokeThickness="1"/> </s:FastLineRenderableSeries.PointMarker> </s:FastLineRenderableSeries> </s:SciChartSurface.RenderableSeries> | |
Code
| EllipsePointMarker |
Copy Code |
|---|---|
var rSeries = new FastLineRenderableSeries(); rSeries.PointMarker = new EllipsePointMarker() { Fill = Colors.LightSteelBlue, Stroke = Colors.White, StrokeThickness = 1, Width = 7, Height = 7, }; | |
TrianglePointMarker
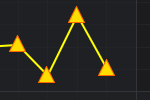 To add a TrianglePointMarker to a RenderableSeries, use the following syntax. This will cause a 7-pixel sized triangle to be rendered at each data-point on the parent FastLineRenderableSeries.. Note that Stroke and Fill may be Transparent if desired.
XAML
| TrianglePointMarker |
Copy Code |
|---|---|
<!-- where xmlns:s="http://schemas.abtsoftware.co.uk/scichart" --> <s:SciChartSurface.RenderableSeries> <s:FastLineRenderableSeries Stroke="Yellow"> <s:FastLineRenderableSeries.PointMarker> <s:TrianglePointMarker Fill="Yellow" Stroke="Orange" Width="7" Height="7" StrokeThickness="1"/> </s:FastLineRenderableSeries.PointMarker> </s:FastLineRenderableSeries> </s:SciChartSurface.RenderableSeries> | |
Code
| TrianglePointMarker |
Copy Code |
|---|---|
var rSeries = new FastLineRenderableSeries(); rSeries.PointMarker = new TrianglePointMarker() { Fill = Colors.LightSteelBlue, Stroke = Colors.Orange, StrokeThickness = 1, Width = 7, Height = 7, }; | |
InvertedTrianglePointMarker
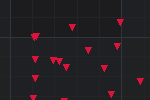 To add an InvertedTrianglePointMarker to a RenderableSeries, use the following syntax. This will cause a 5-pixel sized inverted triangle to be rendered at each data-point on the parent FastLineRenderableSeries.. Note that Stroke and Fill may be Transparent if desired.
XAML
| InvertedTrianglePointMarker |
Copy Code |
|---|---|
<!-- where xmlns:s="http://schemas.abtsoftware.co.uk/scichart" --> <s:SciChartSurface.RenderableSeries> <s:FastLineRenderableSeries Stroke="Yellow"> <s:FastLineRenderableSeries.PointMarker> <s:InvertedTrianglePointMarker Fill="Red" Stroke="Red" Width="5" Height="5" StrokeThickness="1"/> </s:FastLineRenderableSeries.PointMarker> </s:FastLineRenderableSeries> </s:SciChartSurface.RenderableSeries> | |
Code
| InvertedTrianglePointMarker |
Copy Code |
|---|---|
var rSeries = new FastLineRenderableSeries(); rSeries.PointMarker = new InvertedTrianglePointMarker() { Fill = Colors.Red, Stroke = Colors. Red, StrokeThickness = 1, Width = 5, Height = 5, }; | |
CrossPointMarker
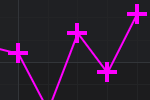 To add a CrossPointMarker to a RenderableSeries, use the following syntax. This will cause a 7-pixel sized cross to be rendered at each data-point on the parent FastLineRenderableSeries.. Note that Stroke and Fill may be Transparent if desired.
XAML
| CrossPointMarker |
Copy Code |
|---|---|
<!-- where xmlns:s="http://schemas.abtsoftware.co.uk/scichart" --> < s:SciChartSurface.RenderableSeries> <s:FastLineRenderableSeries Stroke="Magenta"> <s:FastLineRenderableSeries.PointMarker> <s:CrossPointMarker Stroke="Magenta" Width="7" Height="7" StrokeThickness="1"/> </s:FastLineRenderableSeries.PointMarker> </s:FastLineRenderableSeries> </s:SciChartSurface.RenderableSeries> | |
Code
| CrossPointMarker |
Copy Code |
|---|---|
var rSeries = new FastLineRenderableSeries(); rSeries.PointMarker = new CrossPointMarker() { Stroke = Colors.Magenta, StrokeThickness = 1, Width = 7, Height = 7, }; | |
XPointMarker
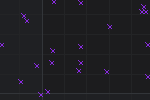 To add an XPointMarker to a RenderableSeries, use the following syntax. This will cause a 5-pixel sized X to be rendered at each data-point on the parent FastLineRenderableSeries. Note that Stroke and Fill may be Transparent if desired.
XAML
| XPointMarker |
Copy Code |
|---|---|
<!-- where xmlns:s="http://schemas.abtsoftware.co.uk/scichart" --> < s:SciChartSurface.RenderableSeries> <s:FastLineRenderableSeries Stroke="Magenta"> <s:FastLineRenderableSeries.PointMarker> <s:XPointMarker Stroke="Magenta" Width="5" Height="5" StrokeThickness="1"/> </s:FastLineRenderableSeries.PointMarker> </s:FastLineRenderableSeries> </s:SciChartSurface.RenderableSeries> | |
Code
| XPointMarker |
Copy Code |
|---|---|
var rSeries = new FastLineRenderableSeries(); rSeries.PointMarker = new XPointMarker () { Stroke = Colors.Magenta, StrokeThickness = 1, Width = 5, Height = 5, }; | |
SquarePointMarker
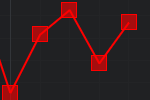 To add a Square point-marker to a RenderableSeries, use the following syntax. This will cause a 7-pixel sized box to be rendered at each data-point on the parent FastLineRenderableSeries.. Note that Stroke and Fill may be Transparent if desired.
XAML
| SquarePointMarker |
Copy Code |
|---|---|
<!-- where xmlns:s="http://schemas.abtsoftware.co.uk/scichart" --> < s:SciChartSurface.RenderableSeries> <s:FastLineRenderableSeries Stroke="#FFFF3333"> <s:FastLineRenderableSeries.PointMarker> <s:SquarePointMarker Fill="#33FF3333" Stroke="#FFFF3333" Width="7" Height="7" StrokeThickness="1"/> </s:FastLineRenderableSeries.PointMarker> </s:FastLineRenderableSeries> </s:SciChartSurface.RenderableSeries> | |
Code
| SquarePointMarker |
Copy Code |
|---|---|
var rSeries = new FastLineRenderableSeries(); rSeries.PointMarker = new SquarePointMarker() { Fill = Color.FromArgb(0x33, 0xFF, 0x33, 0x33), Stroke = Colors.FromArgb(0xFF, 0xFF, 0x33, 0x33), StrokeThickness = 1, Width = 7, Height = 7, }; | |
SpritePointMarker – Transform WPF UIElements into any PointMarker
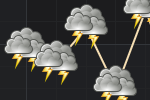 The SpritePointMarker is a special kind of marker which allows any WPF UIElement to be used as a source image when the point-markers are rendered to the screen.
NOTE: Remember that like RenderableSeries, PointMarkers are derived from ContentControl and included in the Visual Tree so that RelativeSource binding works, however they are not rendered using the WPF Composition engine, but instead an alternative Texture-based engine.
This means that SpritePointMarkers are first rendered to a texture, then repeatedly drawn using SciChart’s alternative Raster (bitmap) or DirectX (texture) rendering engine, not using the WPF Composition engine. So any tooltips, DataTempates or bindings put on the ControlTemplate inside the SpritePointMarker will not behave as expected. That being said, we do have an alternative API for Hit-Testing which enables tooltips and mouse-over interactions.
To declare a SpritePointMarker, use the following Syntax. Above we see an image of a Path (thunder cloud) rendered to texture using the SpritePointMarker:
XAML
| SpritePointMarker – Transform WPF UIElements into any PointMarker |
Copy Code |
|---|---|
<!-- where xmlns:s="http://schemas.abtsoftware.co.uk/scichart" --> < s:SciChartSurface.RenderableSeries> <s:FastLineRenderableSeries x:Name="lineSeries" Stroke="White"> <s:FastLineRenderableSeries.PointMarker> <s:SpritePointMarker Width="7" Height="7"> <s:SpritePointMarker.PointMarkerTemplate> <ControlTemplate> <!-- Assumes MyCustomControl is a UserControl, or Path or UIElement --> <!-- You can experiment here by definining a WPF Ellipse with Width, Height=7 and Stroke, Fill --> <MyCustomControl/> </ControlTemplate> </s:SpritePointMarker.PointMarkerTemplate> </s:SpritePointMarker> </s:FastLineRenderableSeries.PointMarker> </s:FastLineRenderableSeries> </s:SciChartSurface.RenderableSeries> | |
BasePointMarker – Draw any PointMarker using our RenderContext API
Another way of creating a custom Point Marker is to override the BasePointMarker class type. Then you can use the methods on IRenderContext2D to draw directly to the RenderSurface using our high-performance bitmap/texture drawing engine. This is not as fast as SpritePointMarker as it doesn’t involve any caching, but it does allow for more customisation, e.g. drawing different pointmarkers for each data-point.
The code for a custom DiamondPointMarker can be found below. Try creating your own Custom PointMarkers and experiment with the methods on IRenderContext2D to get the desired effect.
Code
| BasePointMarker – Draw any PointMarker using our RenderContext API |
Copy Code |
|---|---|
public class DiamondPointMarker : BasePointMarker { public override void Draw(IRenderContext2D context, IEnumerable<Point> centers) { var fill = context.CreateBrush(Fill); var stroke = context.CreatePen(Stroke,AntiAliasing, (float)StrokeThickness); float width2 = (float)(Width * 0.5); float height2 = (float)(Height * 0.5); foreach (var center in centers) { double top = center.Y - height2; double bottom = center.Y + height2; double left = center.X - width2; double right = center.X + width2; var diamondPoints = new[] { // Points drawn like this: // // x0 (x4 in same location as x0) // // x3 x1 // // x2 new Point(center.X, top), // x0 new Point(right, center.Y), // x1 new Point(center.X, bottom), // x2 new Point(left, center.Y), // x3 new Point(center.X, top), // x4 == x0 }; context.FillPolygon(fill, diamondPoints); context.DrawLines(stroke, diamondPoints); } } } | |
NOTE: For more information about the IRenderContext2D see the section on Immediate Mode drawing with RenderContext2D in SciChartGroup – for Multi Pane Stock Charts