WPF Chart - Examples
SciChart WPF ships with hundreds of WPF Chart Examples which you can browse, play with, view the source-code and even export each WPF Chart Example to a stand-alone Visual Studio solution. All of this is possible with the new and improved SciChart WPF Examples Suite, which ships as part of the SciChart WPF SDK.
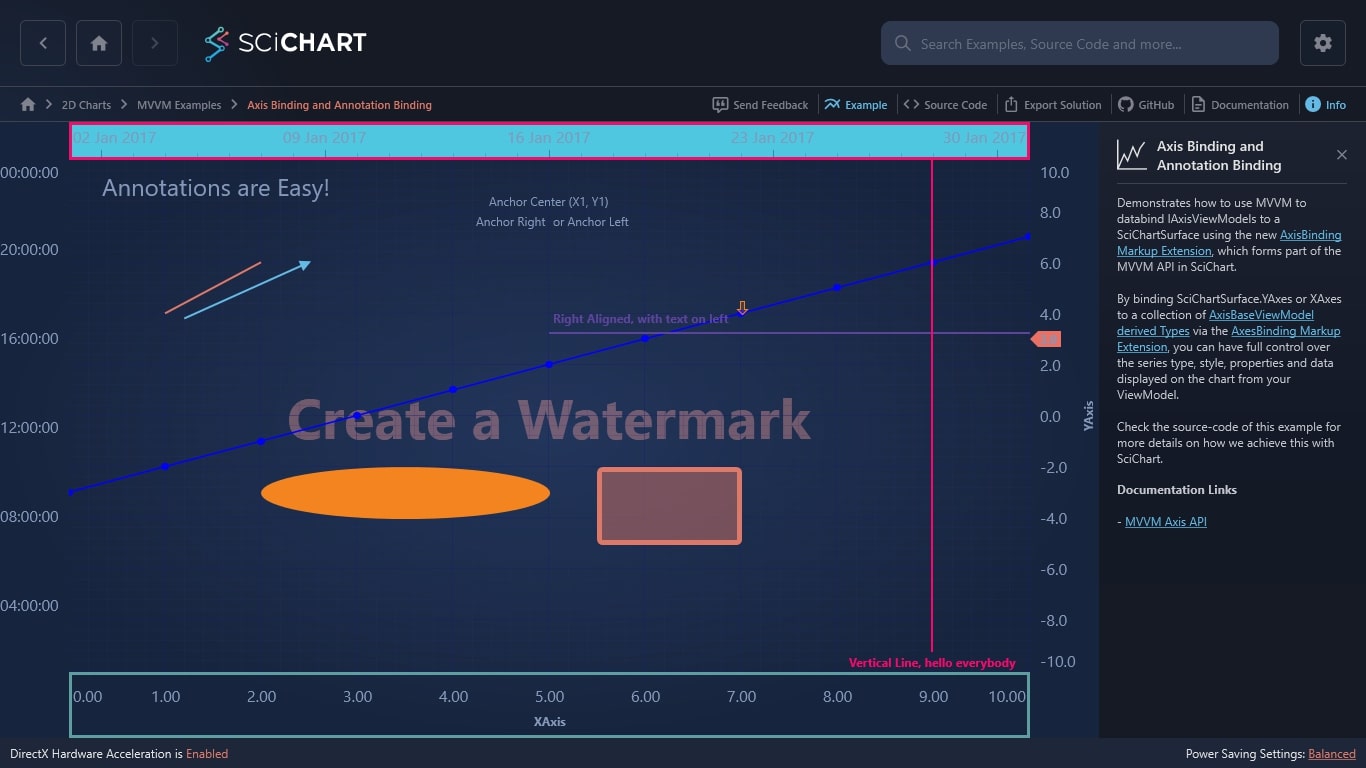
Demonstrates how to use MVVM to databind IAxisViewModels to a SciChartSurface using the new AxisBinding Markup Extension, which forms part of the MVVM API in SciChart.
By binding SciChartSurface.YAxes or XAxes to a collection of AxisBaseViewModel derived Types via the AxesBinding Markup Extension, you can have full control over the series type, style, properties and data displayed on the chart from your ViewModel.
Check the source-code of this example for more details on how we achieve this with SciChart.
Documentation Links

The C#/WPF source code for the WPF Axis Binding and Annotations Binding example is included below (Scroll down!).
Did you know you can also view the source code from one of the following sources as well?
- Clone the SciChart.WPF.Examples from Github.
- Or, view source in the SciChart WPF Examples suite.
- Also the SciChart WPF Trial contains the full source for the examples (link below).
SciChartMvvmBindingsView.xaml
View source code<UserControl x:Class="SciChart.Examples.Examples.UseSciChartWithMvvm.SciChartMVVMBinding.SciChartMvvmBindingsView"
xmlns="http://schemas.microsoft.com/winfx/2006/xaml/presentation"
xmlns:x="http://schemas.microsoft.com/winfx/2006/xaml"
xmlns:mc="http://schemas.openxmlformats.org/markup-compatibility/2006"
xmlns:d="http://schemas.microsoft.com/expression/blend/2008"
xmlns:s="http://schemas.abtsoftware.co.uk/scichart"
xmlns:local="clr-namespace:SciChart.Examples.Examples.UseSciChartWithMvvm.SciChartMVVMBinding"
mc:Ignorable="d"
d:DesignHeight="300" d:DesignWidth="300">
<Grid>
<Grid.ColumnDefinitions>
<ColumnDefinition Width="Auto" />
<ColumnDefinition Width="*" />
</Grid.ColumnDefinitions>
<Grid.Resources>
<Style x:Key="DateTimeAxisStyle" BasedOn="{StaticResource {x:Type s:DateTimeAxisForMvvm}}" TargetType="s:DateTimeAxisForMvvm">
<Setter Property="BorderThickness" Value="3"/>
<Setter Property="Background" Value="DarkBlue"/>
<Setter Property="BorderBrush" Value="CadetBlue"/>
</Style>
</Grid.Resources>
<!-- The SciChartInteractionToolbar adds zoom, pan, zoom extents and rotate functionality -->
<!-- to the chart and is included for example purposes. -->
<!-- If you wish to know how to zoom and pan a chart then do a search for Zoom Pan in the Examples suite! -->
<!--<ext:SciChartInteractionToolbar TargetSurface="{Binding Source={x:Reference Name=sciChart}}"/>-->
<s:SciChartSurface x:Name="sciChart"
Grid.Column="1"
ClipModifierSurface="True"
Padding="0"
Annotations="{s:AnnotationsBinding AnnotationViewModels}"
RenderableSeries="{s:SeriesBinding RenderableSeries}"
XAxes="{s:AxesBinding XAxes}"
YAxes="{s:AxesBinding YAxes}">
<s:SciChartSurface.Resources>
<ControlTemplate x:Key="CustomBoxTemplate">
<Border x:Name="PART_BoxAnnotationRoot" Background="Transparent" BorderThickness="0">
<Ellipse Fill="{TemplateBinding Background}" Stretch="Fill"/>
</Border>
</ControlTemplate>
<Style x:Key="CustomBoxAnnotationStyle" BasedOn="{StaticResource {x:Type s:BoxAnnotationForMvvm}}" TargetType="s:BoxAnnotationForMvvm">
<Setter Property="Background" Value="Gold" />
<Setter Property="Template" Value="{StaticResource CustomBoxTemplate}"/>
</Style>
</s:SciChartSurface.Resources>
</s:SciChartSurface>
</Grid>
</UserControl>SciChartMvvmBindingsView.xaml.cs
View source codeusing System.Windows.Controls;
namespace SciChart.Examples.Examples.UseSciChartWithMvvm.SciChartMVVMBinding
{
/// <summary>
/// Interaction logic for SciChartMvvmBindings.xaml
/// </summary>
public partial class SciChartMvvmBindingsView : UserControl
{
public SciChartMvvmBindingsView()
{
InitializeComponent();
}
}
}
SciChartMvvmBindingsViewModel.cs
View source codeusing System;
using System.Collections.ObjectModel;
using System.Windows;
using System.Windows.Media;
using SciChart.Charting.Model.ChartSeries;
using SciChart.Charting.Model.DataSeries;
using SciChart.Charting.Visuals.Annotations;
using SciChart.Charting.Visuals.Axes;
using SciChart.Charting.Visuals.PointMarkers;
using SciChart.Data.Model;
using SciChart.Examples.ExternalDependencies.Common;
namespace SciChart.Examples.Examples.UseSciChartWithMvvm.SciChartMVVMBinding
{
public class SciChartMvvmBindingsViewModel : BaseViewModel
{
public SciChartMvvmBindingsViewModel()
{
AnnotationViewModels = new ObservableCollection<IAnnotationViewModel>();
InitializeAnnotations();
RenderableSeries = new ObservableCollection<IRenderableSeriesViewModel>();
InitializeRenderableSeries();
XAxes = new ObservableCollection<IAxisViewModel>();
YAxes = new ObservableCollection<IAxisViewModel>();
InitializeAxes();
}
private void InitializeAnnotations()
{
AnnotationViewModels.Add(new TextAnnotationViewModel
{
Text = "Annotations are Easy!",
FontSize = 24,
X1 = 0.3,
Y1 = 9.7
});
// Text with anchor points
AnnotationViewModels.Add(new TextAnnotationViewModel
{
HorizontalAnchorPoint = HorizontalAnchorPoint.Center,
Text = "Anchor Center (X1, Y1)",
VerticalAnchorPoint = VerticalAnchorPoint.Bottom,
X1 = 5.0,
Y1 = 8
});
AnnotationViewModels.Add(new TextAnnotationViewModel
{
HorizontalAnchorPoint = HorizontalAnchorPoint.Right,
Text = "Anchor Right",
VerticalAnchorPoint = VerticalAnchorPoint.Top,
X1 = 5.0,
Y1 = 8.0
});
AnnotationViewModels.Add(new TextAnnotationViewModel
{
HorizontalAnchorPoint = HorizontalAnchorPoint.Left,
VerticalAnchorPoint = VerticalAnchorPoint.Top,
Text = "or Anchor Left",
X1 = 5.0,
Y1 = 8.0
});
// Watermark
AnnotationViewModels.Add(new TextAnnotationViewModel
{
AnnotationCanvas = AnnotationCanvas.BelowChart,
CoordinateMode = AnnotationCoordinateMode.Relative,
HorizontalAnchorPoint = HorizontalAnchorPoint.Center,
Text = "Create a Watermark",
VerticalAnchorPoint = VerticalAnchorPoint.Center,
X1 = 0.5,
Y1 = 0.5,
FontSize = 56,
FontWeight = FontWeights.Bold,
Foreground = new SolidColorBrush(Color.FromArgb(101, 247, 161, 161))
});
AnnotationViewModels.Add(new LineAnnotationViewModel
{
Stroke = Colors.Chartreuse,
StrokeThickness = 2,
Tooltip = "Hi, I am tooltip!",
X1 = 1,
X2 = 2,
Y1 = 4,
Y2 = 6
});
AnnotationViewModels.Add(new HorizontalLineAnnotationViewModel
{
HorizontalAlignment = HorizontalAlignment.Right,
FontSize = 12,
FontWeight = FontWeights.Bold,
LabelPlacement = LabelPlacement.TopLeft,
LabelValue = "Right Aligned, with text on left",
ShowLabel = true,
Stroke = Colors.Orange,
StrokeThickness = 2,
X1 = 5,
X2 = 6,
Y1 = 3.2,
IsEditable = true
});
AnnotationViewModels.Add(new LineArrowAnnotationViewModel
{
Stroke = Colors.Cyan,
StrokeThickness = 2,
X1 = 1.2,
X2 = 2.5,
Y1 = 3.8,
Y2 = 6,
HeadWidth = 8,
HeadLength = 4
});
AnnotationViewModels.Add(new VerticalLineAnnotationViewModel
{
VerticalAlignment = VerticalAlignment.Stretch,
FontSize = 12,
FontWeight = FontWeights.Bold,
ShowLabel = true,
Stroke = Colors.Brown,
LabelValue = "Vertical Line, hello everybody",
LabelPlacement = LabelPlacement.Bottom,
StrokeThickness = 2,
X1 = 9,
Y1 = 4,
IsEditable = true
});
AnnotationViewModels.Add(new BoxAnnotationViewModel
{
Background = new SolidColorBrush(Colors.LawnGreen),
BorderBrush = new SolidColorBrush(Colors.DarkGreen),
BorderThickness = new Thickness(5),
CornerRadius = new CornerRadius(3),
X1 = 5.5,
X2 = 7,
Y1 = -2,
Y2 = -5,
IsEditable = true
});
AnnotationViewModels.Add(new AxisMarkerAnnotationViewModel
{
X1 = 4,
Y1 = 3,
Background = new SolidColorBrush(Colors.Red),
IsEditable = true
});
AnnotationViewModels.Add(new ArrowAnnotationViewModel
{
X1 = 6.96,
Y1 = 5.05,
IsEditable = true
});
AnnotationViewModels.Add(new BoxAnnotationViewModel
{
X1 = 2,
X2 = 5,
Y1 = -2,
Y2 = -4,
IsEditable = true,
StyleKey = "CustomBoxAnnotationStyle"
});
}
private void InitializeRenderableSeries()
{
var renderableSeries = new LineRenderableSeriesViewModel
{
Stroke = Colors.Blue,
StrokeThickness = 2,
PointMarker = new EllipsePointMarker()
};
var dataSeries = new UniformXyDataSeries<double>();
renderableSeries.DataSeries = dataSeries;
for (int i = 0; i < 11; ++i)
{
dataSeries.Append(i - 3);
}
RenderableSeries.Add(renderableSeries);
}
private void InitializeAxes()
{
var xNumAxis = new NumericAxisViewModel
{
AxisAlignment = AxisAlignment.Bottom,
AxisTitle = "XAxis",
DrawMajorBands = false,
TextFormatting = "0.00#",
VisibleRange = new DoubleRange(0, 10),
BorderThickness = new Thickness(3),
BorderBrush = new SolidColorBrush(Colors.CadetBlue)
};
XAxes.Add(xNumAxis);
var xDateTimeAxis = new DateTimeAxisViewModel
{
AxisAlignment = AxisAlignment.Top,
Id = "DateTimeAxis",
VisibleRange = new DateRange(new DateTime(2017, 1, 1), new DateTime(2017, 1, 31)),
StyleKey = "DateTimeAxisStyle"
};
XAxes.Add(xDateTimeAxis);
var yNumAxis = new NumericAxisViewModel
{
AxisTitle = "YAxis",
DrawMajorBands = false,
TextFormatting = "0.0#",
VisibleRange = new DoubleRange(-10, 10)
};
YAxes.Add(yNumAxis);
var yTimeSpanAxis = new TimeSpanAxisViewModel
{
Id = "TimeSpanAxis",
DrawMajorBands = false,
VisibleRange = new TimeSpanRange(TimeSpan.FromHours(1), TimeSpan.FromHours(24)),
AxisAlignment = AxisAlignment.Left
};
YAxes.Add(yTimeSpanAxis);
}
public ObservableCollection<IAnnotationViewModel> AnnotationViewModels { get; set; }
public ObservableCollection<IRenderableSeriesViewModel> RenderableSeries { get; set; }
public ObservableCollection<IAxisViewModel> XAxes { get; set; }
public ObservableCollection<IAxisViewModel> YAxes { get; set; }
}
}ArrowAnnotationView.xaml
View source code<s:CustomAnnotationForMvvm x:Class="SciChart.Examples.Examples.UseSciChartWithMvvm.SciChartMVVMBinding.ArrowAnnotation"
xmlns="http://schemas.microsoft.com/winfx/2006/xaml/presentation"
xmlns:x="http://schemas.microsoft.com/winfx/2006/xaml"
xmlns:mc="http://schemas.openxmlformats.org/markup-compatibility/2006"
xmlns:d="http://schemas.microsoft.com/expression/blend/2008"
xmlns:s="http://schemas.abtsoftware.co.uk/scichart"
mc:Ignorable="d" Margin="0,15,0,0"
>
<Path Data="m 3.5 0.5 4 0 0 8 3 0 -5 5 -5 -5 3 0 z"
Fill="#57B22020"
Stroke="#FF990000"
StrokeThickness="1" />
</s:CustomAnnotationForMvvm>
ArrowAnnotationView.xaml.cs
View source codeusing SciChart.Charting.Visuals.Annotations;
namespace SciChart.Examples.Examples.UseSciChartWithMvvm.SciChartMVVMBinding
{
/// <summary>
/// Interaction logic for ArrowAnnotation.xaml
/// </summary>
public partial class ArrowAnnotation : CustomAnnotationForMvvm
{
public ArrowAnnotation()
{
InitializeComponent();
}
}
}
ArrowAnnotationViewModel.cs
View source codeusing System;
using SciChart.Charting.Model.ChartSeries;
namespace SciChart.Examples.Examples.UseSciChartWithMvvm.SciChartMVVMBinding
{
public class ArrowAnnotationViewModel : BaseAnnotationViewModel
{
public override Type ViewType
{
get { return typeof(ArrowAnnotation); }
}
}
}
