SciChart® the market leader in Fast WPF Charts, WPF 3D Charts, iOS Chart, Android Chart and JavaScript Chart Components
SciChart WPF ships with hundreds of WPF Chart Examples which you can browse, play with, view the source-code and even export each WPF Chart Example to a stand-alone Visual Studio solution. All of this is possible with the new and improved SciChart WPF Examples Suite, which ships as part of the SciChart WPF SDK.
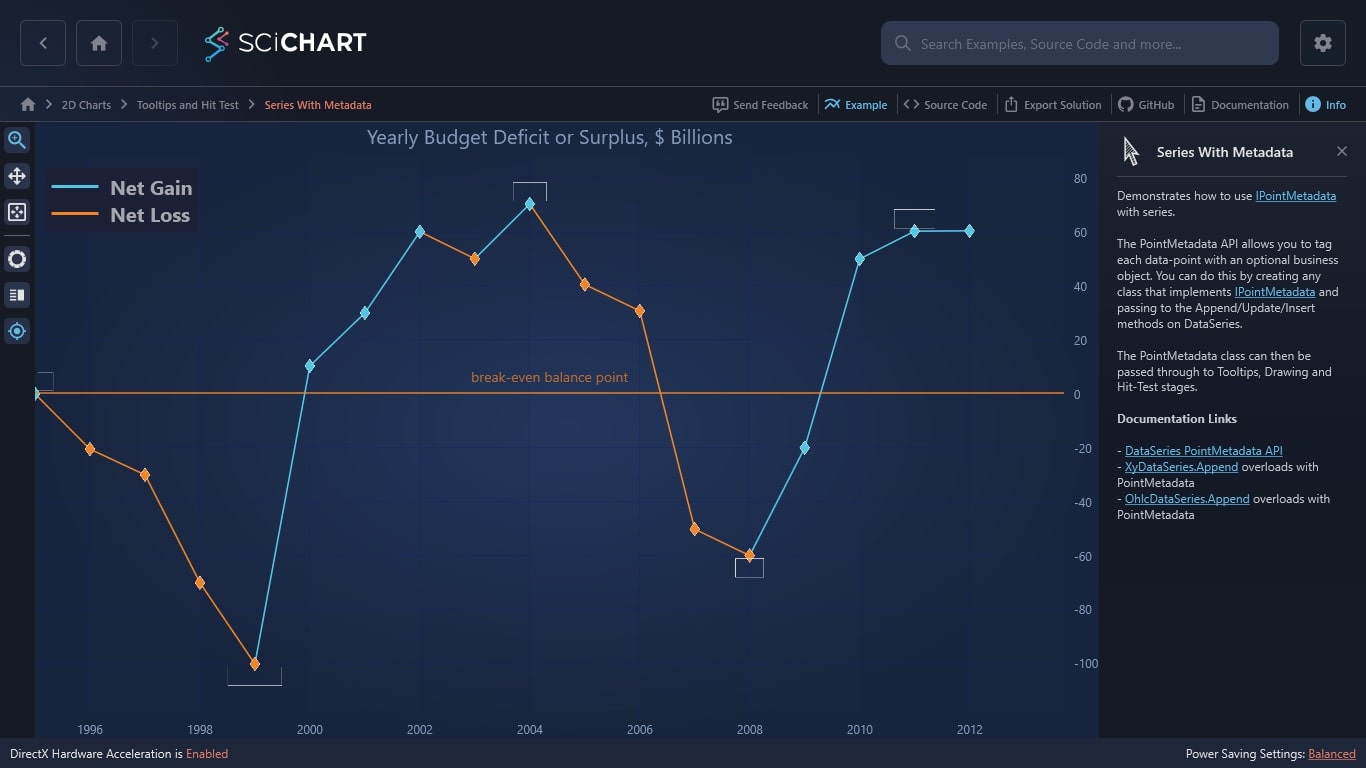
Demonstrates how to use IPointMetadata with series.
The PointMetadata API allows you to tag each data-point with an optional business object. You can do this by creating any class that implements IPointMetadata and passing to the Append/Update/Insert methods on DataSeries.
The PointMetadata class can then be passed through to Tooltips, Drawing and Hit-Test stages.
Documentation Links
– DataSeries PointMetadata API
– XyDataSeries.Append overloads with PointMetadata
– OhlcDataSeries.Append overloads with PointMetadata
The C#/WPF source code for the WPF Chart Series With Metadata example is included below (Scroll down!).
Did you know you can also view the source code from one of the following sources as well?
<UserControl x:Class="SciChart.Examples.Examples.InspectDatapoints.SeriesWithMetadata.SeriesWithMetadata"
xmlns="http://schemas.microsoft.com/winfx/2006/xaml/presentation"
xmlns:x="http://schemas.microsoft.com/winfx/2006/xaml"
xmlns:mc="http://schemas.openxmlformats.org/markup-compatibility/2006"
xmlns:d="http://schemas.microsoft.com/expression/blend/2008"
xmlns:s="http://schemas.abtsoftware.co.uk/scichart"
xmlns:ext="http://schemas.abtsoftware.co.uk/scichart/exampleExternals"
xmlns:seriesWithMetadata="clr-namespace:SciChart.Examples.Examples.InspectDatapoints.SeriesWithMetadata"
mc:Ignorable="d"
d:DesignHeight="400" d:DesignWidth="600"
Loaded="OnSeriesWithMetadataLoaded">
<Grid>
<Grid.Resources>
<seriesWithMetadata:GainLossPaletteProvider x:Key="GainLossPaletteProvider" GainColor="LimeGreen" LossColor="Red"/>
<DataTemplate x:Key="LegendTemplate">
<Grid>
<Grid.RowDefinitions>
<RowDefinition />
<RowDefinition />
</Grid.RowDefinitions>
<Grid.ColumnDefinitions>
<ColumnDefinition Width="50"/>
<ColumnDefinition />
</Grid.ColumnDefinitions>
<Line StrokeThickness="3" X2="1" Stretch="Fill" Stroke="LimeGreen" />
<TextBlock Grid.Column="1" FontSize="20" Text="Net Gain" Margin="10,0,0,0"/>
<Line Grid.Row="1" Stretch="Fill" X2="1" StrokeThickness="3" Stroke="Red"/>
<TextBlock Grid.Row="1" Grid.Column="1" FontSize="20" Text="Net Loss" Margin="10,0,0,0"/>
</Grid>
</DataTemplate>
<Style x:Key="CursorTooltipContainerStyle" TargetType="s:CursorLabelControl">
<Setter Property="Background" Value="{s:ThemeBinding DefaultPath=CursorLabelBackgroundBrush}" />
<Setter Property="BorderThickness" Value="0" />
</Style>
<DataTemplate x:Key="CursorTooltipTemplate" DataType="s:XySeriesInfo">
<StackPanel Orientation="Vertical">
<TextBlock FontSize="15" Foreground="White">
<Run FontWeight="Bold" Text="CEO: "/>
<Run FontWeight="Normal" Text="{Binding PointMetadata.CEO, StringFormat='{}{0}'}"/>
</TextBlock>
<TextBlock FontSize="15" Foreground="White">
<Run FontWeight="Bold" Text="{Binding FormattedXValue, StringFormat='{}{0}: ', Mode=OneWay}"/>
<Run FontWeight="Normal" Text="{Binding PointMetadata.GainLossValue, StringFormat='{}{0:##0.00}$'}"/>
</TextBlock>
</StackPanel>
</DataTemplate>
</Grid.Resources>
<Grid.ColumnDefinitions>
<ColumnDefinition Width="Auto" />
<ColumnDefinition Width="*" />
</Grid.ColumnDefinitions>
<!-- The SciChartInteractionToolbar adds zoom, pan, zoom extents and rotate functionality -->
<!-- to the chart and is included for example purposes. -->
<!-- If you wish to know how to zoom and pan a chart then do a search for Zoom Pan in the Examples suite! -->
<ext:SciChartInteractionToolbar ext:CustomRotateChartModifier.IsRotationEnabled="False" TargetSurface="{Binding Source={x:Reference Name=sciChart}}" />
<!-- Create the chart surface -->
<s:SciChartSurface Name="sciChart"
Grid.Column="1"
BorderThickness="0"
Padding="0"
ChartTitle="Yearly Budget Deficit or Surplus, $ Billions">
<!-- Declare RenderableSeries -->
<s:SciChartSurface.RenderableSeries>
<s:FastLineRenderableSeries x:Name="lineSeries"
StrokeThickness="2"
PaletteProvider="{StaticResource GainLossPaletteProvider}"
s:CursorModifier.TooltipTemplate="{StaticResource CursorTooltipTemplate}">
<s:FastLineRenderableSeries.PointMarker>
<seriesWithMetadata:AnnotatedPointMarker Width="5" Height="7" GainMarkerFill="LimeGreen" LossMarkerFill="Red" Stroke="White" StrokeThickness="1"/>
</s:FastLineRenderableSeries.PointMarker>
</s:FastLineRenderableSeries>
</s:SciChartSurface.RenderableSeries>
<!-- Create an X Axis with Growby -->
<s:SciChartSurface.XAxis>
<s:DateTimeAxis GrowBy="0,0.1"
DrawMajorBands="True"
DrawMinorTicks="False"
DrawMinorGridLines="False"
TextFormatting="yyyy"
CursorTextFormatting="yyyy"/>
</s:SciChartSurface.XAxis>
<!-- Create a Y Axis with Growby. Optional bands give a cool look and feel for minimal performance impact -->
<s:SciChartSurface.YAxis>
<s:NumericAxis GrowBy="0.1,0.1"
DrawMajorBands="False"
DrawMinorTicks="False"
DrawMinorGridLines="False"/>
</s:SciChartSurface.YAxis>
<s:SciChartSurface.Annotations>
<s:HorizontalLineAnnotation Stroke="Red" ShowLabel="False" Y1="0" Opacity="0.7" HorizontalAlignment="Stretch">
<s:AnnotationLabel Text="break-even balance point" LabelPlacement="Top" FontSize="14"/>
</s:HorizontalLineAnnotation>
</s:SciChartSurface.Annotations>
<s:SciChartSurface.ChartModifier>
<s:ModifierGroup>
<s:LegendModifier ShowLegend="True" Margin="10"
LegendItemTemplate="{StaticResource LegendTemplate}" />
<s:CursorModifier ShowTooltip="True"
ShowTooltipOn="MouseHover"
ReceiveHandledEvents="True"
TooltipContainerStyle="{StaticResource CursorTooltipContainerStyle}"/>
</s:ModifierGroup>
</s:SciChartSurface.ChartModifier>
</s:SciChartSurface>
</Grid>
</UserControl>
// *************************************************************************************
// SCICHART® Copyright SciChart Ltd. 2011-2022. All rights reserved.
//
// Web: http://www.scichart.com
// Support: support@scichart.com
// Sales: sales@scichart.com
//
// SeriesWithMetadata.xaml.cs is part of the SCICHART® Examples. Permission is hereby granted
// to modify, create derivative works, distribute and publish any part of this source
// code whether for commercial, private or personal use.
//
// The SCICHART® examples are distributed in the hope that they will be useful, but
// without any warranty. It is provided "AS IS" without warranty of any kind, either
// expressed or implied.
// *************************************************************************************
using System;
using System.Linq;
using System.Windows;
using System.Windows.Controls;
using SciChart.Charting.Common.Extensions;
using SciChart.Charting.Model.DataSeries;
namespace SciChart.Examples.Examples.InspectDatapoints.SeriesWithMetadata
{
/// <summary>
/// Interaction logic for SeriesWithMetadata.xaml
/// </summary>
public partial class SeriesWithMetadata : UserControl
{
public SeriesWithMetadata()
{
InitializeComponent();
}
private void OnSeriesWithMetadataLoaded(object sender, RoutedEventArgs e)
{
var startDate = new DateTime(1995, 1, 1);
// Budget data
var yearsData = Enumerable.Range(0, 18).Select(startDate.AddYears).ToArray();
var gainLossData = new [] {0, -20.5, -30.06, -70.1, -100.22, 10.34, 30.00, 60.12, 50.1, 70.4, 40.55, 30.76, -50.2, -60.00, -20.01, 50.01, 60.32, 60.44};
// Metadata
var executivesData = new [] {"Emerson Irwin", "Reynold Harding", "Carl Carpenter", "Merle Godfrey", "Karl Atterberry"};
var checkPointIndicies = new []{0, 4, 9, 13, 16};
var ceo = executivesData[0];
var budgetMetadata = gainLossData.Select((value, index) =>
{
var metadata = new BudgetPointMetadata(value);
if (checkPointIndicies.Contains(index))
{
metadata.IsCheckPoint = true;
var ceoIndex = checkPointIndicies.IndexOf(index);
ceo = executivesData[ceoIndex];
}
metadata.CEO = ceo;
return metadata;
}).ToArray();
var budgetDataSeries = new XyDataSeries<DateTime, double>();
budgetDataSeries.Append(yearsData, gainLossData, budgetMetadata);
lineSeries.DataSeries = budgetDataSeries;
sciChart.ZoomExtents();
}
}
}
// *************************************************************************************
// SCICHART® Copyright SciChart Ltd. 2011-2022. All rights reserved.
//
// Web: http://www.scichart.com
// Support: support@scichart.com
// Sales: sales@scichart.com
//
// AnnotatedPointMarker.cs is part of the SCICHART® Examples. Permission is hereby granted
// to modify, create derivative works, distribute and publish any part of this source
// code whether for commercial, private or personal use.
//
// The SCICHART® examples are distributed in the hope that they will be useful, but
// without any warranty. It is provided "AS IS" without warranty of any kind, either
// expressed or implied.
// *************************************************************************************
using System.Collections.Generic;
using System.Linq;
using System.Windows;
using System.Windows.Controls;
using System.Windows.Media;
using SciChart.Charting.Model.DataSeries;
using SciChart.Charting.Visuals.PointMarkers;
using SciChart.Core.Extensions;
using SciChart.Drawing.Common;
namespace SciChart.Examples.Examples.InspectDatapoints.SeriesWithMetadata
{
public class AnnotatedPointMarker : BasePointMarker
{
private const float TextSize = 14f;
private const double TextIndent = 3f;
private IList<IPointMetadata> _dataPointMetadata;
private IList<int> _dataPointIndexes;
private IPen2D _strokePen;
private IBrush2D _gainFillBrush;
private IBrush2D _lossFillBrush;
private readonly TextBlock _textBlock;
public Color GainMarkerFill { get; set; }
public Color LossMarkerFill { get; set; }
public AnnotatedPointMarker()
{
_dataPointIndexes = new List<int>();
_textBlock = new TextBlock { FontSize = TextSize };
SetCurrentValue(PointMarkerBatchStrategyProperty, new DefaultPointMarkerBatchStrategy());
}
public override void BeginBatch(IRenderContext2D context, Color? strokeColor, Color? fillColor)
{
_dataPointMetadata = _dataPointMetadata ?? RenderableSeries.DataSeries.Metadata;
_dataPointIndexes = new List<int>();
base.BeginBatch(context, strokeColor, fillColor);
}
public override void MoveTo(IRenderContext2D context, double x, double y, int index)
{
if (IsInBounds(x, y))
{
_dataPointIndexes.Add(index);
}
base.MoveTo(context, x, y, index);
}
public override void Draw(IRenderContext2D context, IEnumerable<Point> centers)
{
TryCacheResources(context);
var markerLocations = centers.ToArray();
var locationIndex = 0;
var prevValue = 0d;
for (int i = 0; i < _dataPointMetadata.Count; ++i)
{
if (_dataPointMetadata[i] is BudgetPointMetadata metadata)
{
var isGain = metadata.GainLossValue >= prevValue;
prevValue = metadata.GainLossValue;
if (_dataPointIndexes.Contains(i))
{
var center = markerLocations[locationIndex];
var gainLossValue = metadata.GainLossValue + "$";
DrawDiamond(context, center, Width, Height, _strokePen, isGain ? _gainFillBrush : _lossFillBrush);
_textBlock.Text = gainLossValue;
_textBlock.MeasureArrange();
var xPos = center.X - _textBlock.DesiredSize.Width / 2;
xPos = xPos < 0 ? TextIndent : xPos;
var marginalRightPos = context.ViewportSize.Width - _textBlock.DesiredSize.Width - TextIndent;
xPos = xPos > marginalRightPos ? marginalRightPos : xPos;
var yPos = center.Y;
var yOffset = isGain ? -_textBlock.DesiredSize.Height - TextIndent : TextIndent;
yPos += yOffset;
var textRect = new Rect(xPos, yPos, _textBlock.DesiredSize.Width, _textBlock.DesiredSize.Height);
context.DrawText(textRect, Stroke, TextSize, gainLossValue, FontFamily, FontWeight, FontStyle);
if (metadata.IsCheckPoint)
context.DrawQuad(_strokePen, textRect.TopLeft, textRect.BottomRight);
locationIndex++;
}
}
}
}
private void TryCacheResources(IRenderContext2D context)
{
if (!context.IsCompatibleType(_strokePen))
Dispose();
_strokePen = _strokePen ?? context.CreatePen(Stroke, AntiAliasing, (float)StrokeThickness, Opacity);
_gainFillBrush = _gainFillBrush ?? context.CreateBrush(GainMarkerFill);
_lossFillBrush = _lossFillBrush ?? context.CreateBrush(LossMarkerFill);
}
private void DrawDiamond(IRenderContext2D context, Point center, double width, double height, IPen2D stroke, IBrush2D fill)
{
double top = center.Y - height;
double bottom = center.Y + height;
double left = center.X - width;
double right = center.X + width;
var diamondPoints = new[]
{
// Points drawn like this:
//
// x0 (x4 in same location as x0)
//
// x3 x1
//
// x2
new Point(center.X, top),
new Point(right, center.Y),
new Point(center.X, bottom),
new Point(left, center.Y),
new Point(center.X, top),
};
context.FillPolygon(fill, diamondPoints);
context.DrawLines(stroke, diamondPoints);
}
public override void Dispose()
{
base.Dispose();
_strokePen.SafeDispose();
_strokePen = null;
_gainFillBrush.SafeDispose();
_gainFillBrush = null;
_lossFillBrush.SafeDispose();
_lossFillBrush = null;
}
}
}
// *************************************************************************************
// SCICHART® Copyright SciChart Ltd. 2011-2022. All rights reserved.
//
// Web: http://www.scichart.com
// Support: support@scichart.com
// Sales: sales@scichart.com
//
// BudgetPointMetadata.cs is part of the SCICHART® Examples. Permission is hereby granted
// to modify, create derivative works, distribute and publish any part of this source
// code whether for commercial, private or personal use.
//
// The SCICHART® examples are distributed in the hope that they will be useful, but
// without any warranty. It is provided "AS IS" without warranty of any kind, either
// expressed or implied.
// *************************************************************************************
using System;
using System.Collections.Generic;
using System.ComponentModel;
using System.Linq;
using System.Text;
using SciChart.Charting.Model.DataSeries;
namespace SciChart.Examples.Examples.InspectDatapoints.SeriesWithMetadata
{
public class BudgetPointMetadata : IPointMetadata
{
public event PropertyChangedEventHandler PropertyChanged;
public BudgetPointMetadata(double gainLossValue)
{
GainLossValue = gainLossValue;
}
public bool IsSelected { get; set; }
public bool IsCheckPoint { get; set; }
public double GainLossValue { get; set; }
public string CEO { get; set; }
}
}
// *************************************************************************************
// SCICHART® Copyright SciChart Ltd. 2011-2022. All rights reserved.
//
// Web: http://www.scichart.com
// Support: support@scichart.com
// Sales: sales@scichart.com
//
// GainLossPaletteProvider.cs is part of the SCICHART® Examples. Permission is hereby granted
// to modify, create derivative works, distribute and publish any part of this source
// code whether for commercial, private or personal use.
//
// The SCICHART® examples are distributed in the hope that they will be useful, but
// without any warranty. It is provided "AS IS" without warranty of any kind, either
// expressed or implied.
// *************************************************************************************
using System;
using System.Collections.Generic;
using System.Linq;
using System.Text;
using System.Windows.Media;
using SciChart.Charting.Model.DataSeries;
using SciChart.Charting.Visuals.PaletteProviders;
using SciChart.Charting.Visuals.RenderableSeries;
namespace SciChart.Examples.Examples.InspectDatapoints.SeriesWithMetadata
{
public class GainLossPaletteProvider : IStrokePaletteProvider
{
private double _previousValue = 0d;
public Color GainColor { get; set; }
public Color LossColor { get; set; }
/// <summary>
/// Called at the start of an renderable series rendering, before the current draw operation.
/// </summary>
/// <param name="series"></param>
public void OnBeginSeriesDraw(IRenderableSeries series)
{
_previousValue = 0d;
}
/// <summary>
/// Overrides the color of the outline on the attached <see cref="IRenderableSeries" />.
/// Return null to keep the default series color.
/// Return a value to override the series color.
/// </summary>
/// <param name="rSeries">The source <see cref="IRenderableSeries" />.</param>
/// <param name="index">The index of the data-point. To get X,Y values use rSeries.DataSeries.XValues[index] etc...</param>
/// <param name="metadata">The PointMetadata associated with this X,Y data-point.</param>
/// <returns></returns>
public Color? OverrideStrokeColor(IRenderableSeries rSeries, int index, IPointMetadata metadata)
{
// Note: Since IPointMetadata is now passed to palette provider, we can use this too to affect coloring.
// In this case we use only YValue but #justsaying
var currentValue = (double)rSeries.DataSeries.YValues[index];
var isLoss = currentValue < _previousValue;
_previousValue = currentValue;
return isLoss ? LossColor : GainColor;
}
}
}