
PointMetadata
DataSeries now feature optional PointMetadata – a class which can be tagged onto one or more X,Y data-points, and passed through to all stages, including PaletteProvider, Hit-Test and Tool-tips.
The DataSeries API expects an IPointMetadata derived type to be passed in. This can be any class you like. It will be passed through to the PaletteProvider, Tooltips, PointMarkers and Hit-Test API and can be used to tag additional data to a data-point.
PointMetadata - Example of use
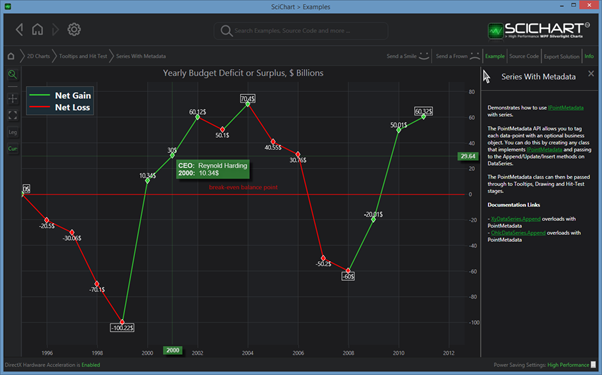
The SciChart v4.x Examples Suite contains an example of PointMetadata usage. Please see the example 2D Charts > Tooltips and Hit-Test > Series With Metadata
Creating PointMetadata Types
To use the PointMetadata feature, first you need to create a type which implements IPointMetadata. In our Series With Metadata Example, we have a class called BudgetMetadata, which is found below:
| Creating PointMetadata Types |
Copy Code |
|---|---|
public class BudgetPointMetadata : IPointMetadata { public event PropertyChangedEventHandler PropertyChanged; public BudgetPointMetadata(double gainLossValue) { GainLossValue = gainLossValue; } public bool IsSelected { get; set; } public bool IsCheckPoint { get; set; } public double GainLossValue { get; set; } public string CEO { get; set; } } | |
IPointMetadata implements INotifyPropertyChanged, and has one property: IsSelected. Any other properties, methods or fields can be added to your custom IPointMetadata derived type.
Appending PointMetadata to DataSeries
With the IPointMetadata type declared, they may be appended to DataSeries using the overloaded Append, Update, Insert methods. It also is acceptable to pass Null for PointMetadata for X,Y points without a metadata value.
| Appending PointMetadata to DataSeries |
Copy Code |
|---|---|
var xyDataSeries = new XyDataSeries<DateTime, double>(); budgetDataSeries.Append(0, 1.234, new BudgetPointMetadata(45.25)); budgetDataSeries.Append(1, 2.345, new BudgetPointMetadata(22.10)); budgetDataSeries.Append(2, 3.456, null)); | |
NOTE: The default DataSeries.Append method accepts X,Y values only. Passing in a PointMetadata for at least one point will cause the DataSeries memory to increase by 50%, as an extra column has to be created.
Displaying PointMetadata in Tooltips
PointMetadata classes may be used in Tooltips on the chart. In the Series Metadata example, the CursorModifier is used. The CursorModifier TooltipTemplate is changed in order to display data from the BudgetPointMetadata type. The full example for this can be found at https://www.scichart.com/example/wpf-chart-example-series-with-metadata/
| Displaying PointMetadata in Tooltips |
Copy Code |
|---|---|
<Grid> <Grid.Resources> <Style x:Key="CursorTooltipContainerStyle" TargetType="s:CursorLabelControl"> <Setter Property="Background" Value="{s:ThemeBinding DefaultPath=CursorLabelBackgroundBrush}" /> <Setter Property="BorderThickness" Value="0" /> </Style> <DataTemplate x:Key="CursorTooltipTemplate" DataType="s:XySeriesInfo"> <StackPanel Orientation="Vertical"> <TextBlock FontSize="15" Foreground="White"> <Run FontWeight="Bold" Text="CEO: "/> <Run FontWeight="Normal" Text="{Binding PointMetadata.CEO, StringFormat='{}{0}'}"/> </TextBlock> <TextBlock FontSize="15" Foreground="White"> <Run FontWeight="Bold" Text="{Binding FormattedXValue, StringFormat='{}{0}: ', Mode=OneWay}"/> <Run FontWeight="Normal" Text="{Binding PointMetadata.GainLossValue, StringFormat='{}{0:##0.00}$'}"/> </TextBlock> </StackPanel> </DataTemplate> </Grid.Resources> <!-- Create the chart surface --> <s:SciChartSurface Name="sciChart" Grid.Column="1" BorderThickness="0" Padding="0" ChartTitle="Yearly Budget Deficit or Surplus, $ Billions"> <!-- Declare RenderableSeries --> <s:SciChartSurface.RenderableSeries> <s:FastLineRenderableSeries x:Name="lineSeries" StrokeThickness="2" s:CursorModifier.TooltipTemplate="{StaticResource CursorTooltipTemplate}"> <s:FastLineRenderableSeries.PointMarker> <seriesWithMetadata:AnnotatedPointMarker Width="5" Height="7" GainMarkerFill="LimeGreen" LossMarkerFill="Red" Stroke="White" StrokeThickness="1"/> </s:FastLineRenderableSeries.PointMarker> </s:FastLineRenderableSeries> </s:SciChartSurface.RenderableSeries> <!-- Create an X Axis with Growby --> <s:SciChartSurface.XAxis> <s:DateTimeAxis GrowBy="0,0.1" DrawMajorBands="True" DrawMinorTicks="False" DrawMinorGridLines="False" TextFormatting="yyyy" CursorTextFormatting="yyyy"/> </s:SciChartSurface.XAxis> <!-- Create a Y Axis with Growby. Optional bands give a cool look and feel for minimal performance impact --> <s:SciChartSurface.YAxis> <s:NumericAxis GrowBy="0.1,0.1" DrawMajorBands="False" DrawMinorTicks="False" DrawMinorGridLines="False"/> </s:SciChartSurface.YAxis> <s:SciChartSurface.ChartModifier> <s:ModifierGroup> <s:CursorModifier ShowTooltip="True" ShowTooltipOn="MouseHover" TooltipContainerStyle="{StaticResource CursorTooltipContainerStyle}"/> </s:ModifierGroup> </s:SciChartSurface.ChartModifier> </s:SciChartSurface> </Grid> | |
In the example above, the CursorModifier.CursorTooltipContainerStyle has been modified to create a tooltip which binds to PointMetadata. The DataContext for Tooltips is always a SeriesInfo derived type. In this case, XySeriesInfo (as the example uses XyDataSeries).
SeriesInfo exposes the X,Y values, as well as the PointMetadata for a specific point.
Further Reading: See Section 4.11 on creating and templating tooltips with SciChart. Also see Section 4.11.7 which details the SeriesInfo derived types.
Using PointMetadata in PaletteProviders
PointMetadata can also be used to affect per-point coloring of RenderableSeries. In the SeriesMetadata example, we create a custom IStrokePaletteProvider derived type. PointMetadata is now passed to the PaletteProvider methods, so after a cast, any properties used on your custom IPointMetadata derived type can be used to affect paletting (coloring) of the series.
Further Reading: See Section Cursors, Tooltips and Legends which shows how to use the PaletteProvider API in SciChart.
Resampling
DataSeries feature resampling via the DataSeries.ToPointSeries() method. This reduces the data to a minimum data-set for display on screen, for the most efficient drawing. Resampling is intended to provide pre-culling of data given the properties of the data-series, e.g.
- Data is sorted in X or not
- Data is evenly spaced in X or not
- Data is rendered as a line, or as a point (scatter)
- Current viewport size (Pixel width, Pixel height)
In the vast majority of cases Resampling is automatic (requires no setting by the user). Resampling is also lossless (visually no different to drawing all data). There are however some cases where it cannot be used without visual anomalies. These include:
- Where XAxis is a LogarithmicNumericAxis (You must set ResamplingMode.None on RenderableSeries)
- Where data is unsorted in X (SciChart automatically choses no-resampling)