WPF Chart - Examples
SciChart WPF ships with hundreds of WPF Chart Examples which you can browse, play with, view the source-code and even export each WPF Chart Example to a stand-alone Visual Studio solution. All of this is possible with the new and improved SciChart WPF Examples Suite, which ships as part of the SciChart WPF SDK.
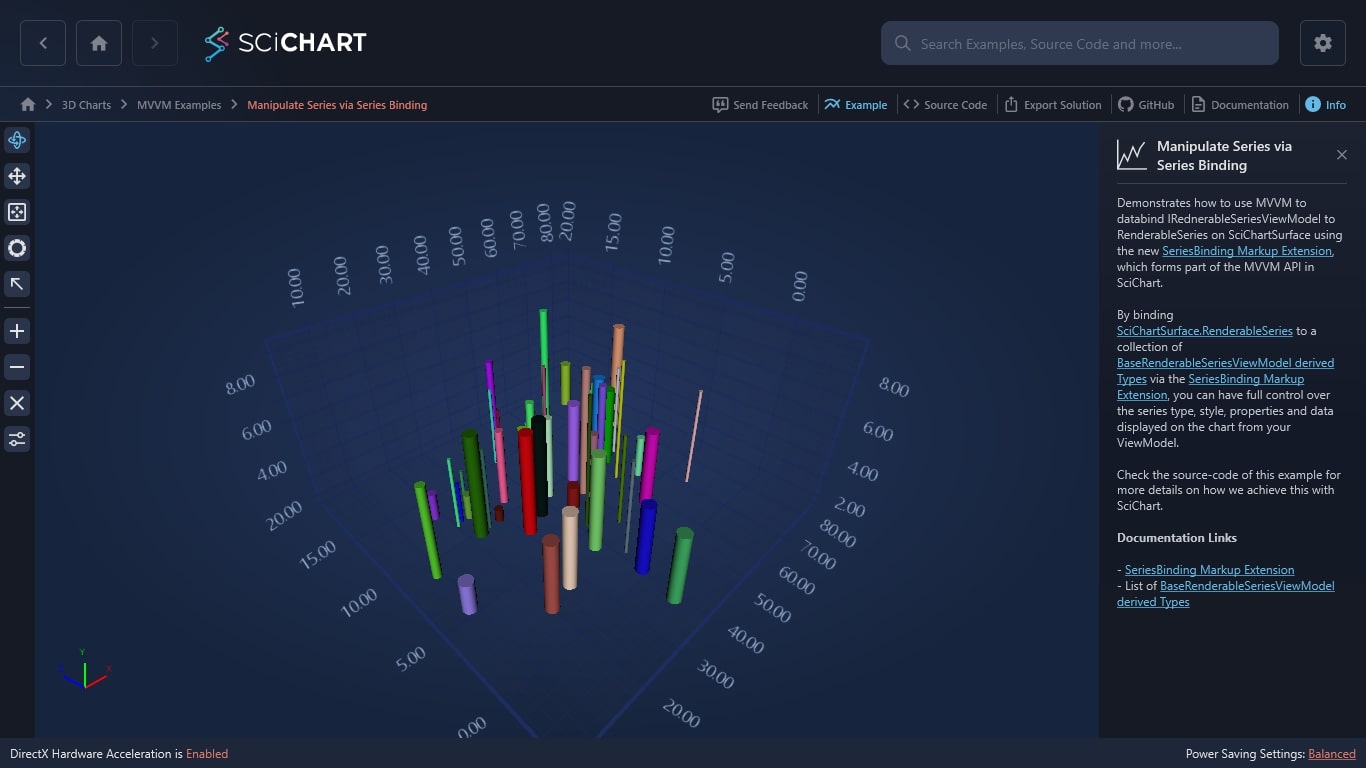
Demonstrates how to use MVVM to databind IRednerableSeriesViewModel to RenderableSeries on SciChartSurface using the new SeriesBinding Markup Extension, which forms part of the MVVM API in SciChart.
By binding SciChartSurface.RenderableSeries to a collection of BaseRenderableSeriesViewModel derived Types via the SeriesBinding Markup Extension, you can have full control over the series type, style, properties and data displayed on the chart from your ViewModel.
Check the source-code of this example for more details on how we achieve this with SciChart.
Documentation Links
– SeriesBinding Markup Extension
– List of BaseRenderableSeriesViewModel derived Types

The C#/WPF source code for the WPF Manipulate series via Series Binding example is included below (Scroll down!).
Did you know you can also view the source code from one of the following sources as well?
- Clone the SciChart.WPF.Examples from Github.
- Or, view source in the SciChart WPF Examples suite.
- Also the SciChart WPF Trial contains the full source for the examples (link below).
ManipulateSeries3DMvvmView.xaml
View source code<UserControl x:Class="SciChart.Examples.Examples.Charts3D.ManipulateSeries3DMVVM.ManipulateSeries3DMvvmView"
xmlns="http://schemas.microsoft.com/winfx/2006/xaml/presentation"
xmlns:x="http://schemas.microsoft.com/winfx/2006/xaml"
xmlns:mc="http://schemas.openxmlformats.org/markup-compatibility/2006"
xmlns:d="http://schemas.microsoft.com/expression/blend/2008"
xmlns:local="clr-namespace:SciChart.Examples.Examples.Charts3D.ManipulateSeries3DMVVM"
xmlns:s3D="http://schemas.abtsoftware.co.uk/scichart3D"
xmlns:ext="http://schemas.abtsoftware.co.uk/scichart/exampleExternals"
xmlns:extensions="clr-namespace:SciChart.Charting3D.Common.Extensions;assembly=SciChart.Charting3D"
xmlns:renderableSeries="clr-namespace:SciChart.Charting3D.Visuals.RenderableSeries;assembly=SciChart.Charting3D"
mc:Ignorable="d"
d:DesignHeight="300" d:DesignWidth="300">
<UserControl.DataContext>
<local:ManipulateSeries3DMvvmViewModel/>
</UserControl.DataContext>
<UserControl.Resources>
<ResourceDictionary>
<ResourceDictionary.MergedDictionaries>
<ResourceDictionary
Source="/SciChart.Examples.ExternalDependencies;component/Resources/Styles/MergedResources.xaml" />
<ResourceDictionary
Source="/SciChart.Examples.ExternalDependencies;component/Resources/Styles/ToolbarButtonsCommon.xaml" />
<ResourceDictionary
Source="/SciChart.Examples.ExternalDependencies;component/Resources/Styles/SciChartExampleToolbar.xaml" />
<ResourceDictionary
Source="Styles.xaml"/>
</ResourceDictionary.MergedDictionaries>
</ResourceDictionary>
</UserControl.Resources>
<Grid>
<Grid.ColumnDefinitions>
<ColumnDefinition Width="Auto" />
<ColumnDefinition Width="*" />
</Grid.ColumnDefinitions>
<!-- The SciChart3DInteractionToolbar adds rotate, orbit, zoom, pan, zoom extents functionality -->
<!-- to the chart and is included for example purposes. -->
<!-- If you wish to know how to zoom and pan a 3D chart then do a search for Zoom Pan in the Examples suite! -->
<ext:SciChart3DInteractionToolbar Grid.Column="0" TargetSurface="{Binding Source={x:Reference Name=SciChart}}">
<ext:FlyoutSeparator Background="#444" />
<Button Command="{Binding AddCommand}"
Content="+"
FontSize="18"
Padding="0"
Style="{StaticResource DefaultButtonStyle}"
ToolTipService.ToolTip="Add Series of Selected Type" />
<Button Command="{Binding RemoveCommand}"
Content="-"
FontSize="18"
Padding="0"
Style="{StaticResource DefaultButtonStyle}"
ToolTipService.ToolTip="Remove Selected Series" />
<Button Command="{Binding ClearCommand}"
Content="CLR"
FontSize="11"
Padding="0"
Style="{StaticResource DefaultButtonStyle}"
ToolTipService.ToolTip="Clear all series" />
<ext:FlyoutMenuButton Content="ST"
Padding="0"
Style="{StaticResource FlyoutMenuButtonStyle}">
<ext:FlyoutMenuButton.PopupContent>
<StackPanel MinWidth="150" Orientation="Vertical">
<TextBlock Text="Series3DViewModel Type" />
<ext:FlyoutSeparator />
<ComboBox ItemsSource="{Binding SeriesTypes}"
SelectedIndex="5"
SelectedItem="{Binding SelectedType,
Mode=OneWayToSource}" />
</StackPanel>
</ext:FlyoutMenuButton.PopupContent>
</ext:FlyoutMenuButton>
</ext:SciChart3DInteractionToolbar>
<s3D:SciChart3DSurface x:Name="SciChart"
Grid.Column="1"
BorderThickness="0"
RenderableSeries="{extensions:SeriesBinding RenderableSeries}"
WorldDimensions="200,100,200">
<s3D:SciChart3DSurface.Camera>
<s3D:Camera3D ZoomToFitOnAttach="True" />
</s3D:SciChart3DSurface.Camera>
<s3D:SciChart3DSurface.XAxis>
<s3D:NumericAxis3D AutoRange="Always" GrowBy="0.1,0.1" />
</s3D:SciChart3DSurface.XAxis>
<s3D:SciChart3DSurface.YAxis>
<s3D:NumericAxis3D AutoRange="Always" GrowBy="0.1,0.1" />
</s3D:SciChart3DSurface.YAxis>
<s3D:SciChart3DSurface.ZAxis>
<s3D:NumericAxis3D AutoRange="Always" GrowBy="0.1,0.1" />
</s3D:SciChart3DSurface.ZAxis>
<s3D:SciChart3DSurface.ChartModifier>
<s3D:ModifierGroup3D>
<s3D:FreeLookModifier3D ExecuteOn="MouseLeftButton"
ExecuteWhen="Shift"
IsEnabled="False" />
<s3D:OrbitModifier3D ExecuteOn="MouseLeftButton" />
<s3D:VertexSelectionModifier3D ExecuteOn="MouseLeftButton"
ExecuteWhen="Ctrl"
IsEnabled="False" />
<s3D:MouseWheelZoomModifier3D />
<s3D:ZoomExtentsModifier3D AnimateDurationMs="500"
ResetPosition="200,200,200"
ResetTarget="0,0,0" />
</s3D:ModifierGroup3D>
</s3D:SciChart3DSurface.ChartModifier>
</s3D:SciChart3DSurface>
</Grid>
</UserControl>
ManipulateSeries3DMvvmView.xaml.cs
View source codeusing System;
using System.Collections.Generic;
using System.Linq;
using System.Text;
using System.Windows;
using System.Windows.Controls;
using System.Windows.Data;
using System.Windows.Documents;
using System.Windows.Input;
using System.Windows.Media;
using System.Windows.Media.Imaging;
using System.Windows.Navigation;
using System.Windows.Shapes;
namespace SciChart.Examples.Examples.Charts3D.ManipulateSeries3DMVVM
{
/// <summary>
/// Interaction logic for ManipulateSeries3DMvvmView.xaml
/// </summary>
public partial class ManipulateSeries3DMvvmView : UserControl
{
public ManipulateSeries3DMvvmView()
{
InitializeComponent();
}
}
}
ManipulateSeries3DMvvmViewModel.cs
View source codeusing System.Collections.ObjectModel;
using System.Linq;
using SciChart.Charting.Common.Helpers;
using SciChart.Charting3D.Visuals.RenderableSeries;
using SciChart.Examples.ExternalDependencies.Common;
namespace SciChart.Examples.Examples.Charts3D.ManipulateSeries3DMVVM
{
public class ManipulateSeries3DMvvmViewModel : BaseViewModel
{
private string _selectedType;
public ManipulateSeries3DMvvmViewModel()
{
RenderableSeries = new ObservableCollection<IRenderableSeries3DViewModel>();
SeriesTypes = new ObservableCollection<string>
{
"Column Series",
"Impulse Series",
"PointLine Series",
"SurfaceMesh Series",
"Waterfall Series",
"Scatter Series"
};
_selectedType = SeriesTypes[5];
AddCommand = new ActionCommand(() =>
{
RenderableSeries.Add(ViewModelFactory3D.New(SelectedType));
RemoveCommand.RaiseCanExecuteChanged();
ClearCommand.RaiseCanExecuteChanged();
});
RemoveCommand = new ActionCommand(() =>
{
RenderableSeries.Remove(RenderableSeries.Last());
ClearCommand.RaiseCanExecuteChanged();
RemoveCommand.RaiseCanExecuteChanged();
}, () => RenderableSeries.Any());
ClearCommand = new ActionCommand(() =>
{
RenderableSeries.Clear();
ClearCommand.RaiseCanExecuteChanged();
RemoveCommand.RaiseCanExecuteChanged();
}, () => RenderableSeries.Any());
}
public ObservableCollection<IRenderableSeries3DViewModel> RenderableSeries { get; set; }
public ObservableCollection<string> SeriesTypes { get; set; }
public string SelectedType
{
set
{
if (!string.IsNullOrEmpty(value))
{
_selectedType = value;
OnPropertyChanged("SelectedType");
}
}
get { return _selectedType; }
}
public ActionCommand AddCommand { get; private set; }
public ActionCommand RemoveCommand { get; private set; }
public ActionCommand ClearCommand { get; private set; }
}
}
Styles.xaml
View source code<ResourceDictionary xmlns="http://schemas.microsoft.com/winfx/2006/xaml/presentation"
xmlns:x="http://schemas.microsoft.com/winfx/2006/xaml"
xmlns:s3D="http://schemas.abtsoftware.co.uk/scichart3D"
xmlns:renderableSeries="clr-namespace:SciChart.Charting3D.Visuals.RenderableSeries;assembly=SciChart.Charting3D">
<s3D:GradientColorPalette x:Key="HeightColorMap"
ContourColor="Black"
ContourStrokeThickness="2.0">
<s3D:GradientColorPalette.GradientStops>
<GradientStop Offset="1" Color="DarkRed" />
<GradientStop Offset="0.9" Color="Red" />
<GradientStop Offset="0.7" Color="Yellow" />
<GradientStop Offset="0.5" Color="GreenYellow" />
<GradientStop Offset="0.3" Color="Cyan" />
<GradientStop Offset="0.1" Color="Blue" />
<GradientStop Offset="0.0" Color="#1D2C6B" />
</s3D:GradientColorPalette.GradientStops>
</s3D:GradientColorPalette>
<s3D:GradientColorPalette x:Key="GradientColorPalette" IsStepped="False">
<s3D:GradientColorPalette.GradientStops>
<GradientStop Offset="0" Color="Red" />
<GradientStop Offset="0.25" Color="Orange" />
<GradientStop Offset="0.5" Color="Yellow" />
<GradientStop Offset="0.75" Color="Green" />
<GradientStop Offset="1" Color="DarkGreen" />
</s3D:GradientColorPalette.GradientStops>
</s3D:GradientColorPalette>
<Style x:Key="SurfaceMeshStyle" TargetType="renderableSeries:SurfaceMeshRenderableSeries3DForMvvm">
<Setter Property="MeshColorPalette" Value="{StaticResource HeightColorMap}" />
<Setter Property="Stroke" Value="#77228B22" />
</Style>
<Style x:Key="WaterfallStyle" TargetType="renderableSeries:WaterfallRenderableSeries3DForMvvm" BasedOn="{StaticResource {x:Type renderableSeries:WaterfallRenderableSeries3DForMvvm}}" >
<Setter Property="YColorMapping" Value="{StaticResource GradientColorPalette}" />
<Setter Property="ZColorMapping" Value="{StaticResource GradientColorPalette}" />
<!--<Setter Property="Stroke" Value="Purple" />-->
</Style>
<Style x:Key="ColumnStyle3D" TargetType="renderableSeries:ColumnRenderableSeries3DForMvvm">
<Setter Property="ColumnShape" Value="{x:Type s3D:CylinderPointMarker3D}"/>
<Setter Property="Stroke" Value="Aqua" />
</Style>
<Style x:Key="Impulse3DStyle" TargetType="renderableSeries:ImpulseRenderableSeries3DForMvvm">
<Setter Property="Opacity" Value="1"/>
<Setter Property="PointMarker">
<Setter.Value>
<s3D:SpherePointMarker3D Fill="White"
Size="4"
Opacity="1"/>
</Setter.Value>
</Setter>
</Style>
<Style x:Key="PointLine3DStyle" TargetType="renderableSeries:PointLineRenderableSeries3DForMvvm">
<Setter Property="IsAntialiased" Value="True"/>
<Setter Property="PointMarker">
<Setter.Value>
<s3D:EllipsePointMarker3D Fill="LimeGreen"
Size="2"
Opacity="1"/>
</Setter.Value>
</Setter>
</Style>
<Style x:Key="Scatter3DStyle" TargetType="renderableSeries:ScatterRenderableSeries3DForMvvm">
<Setter Property="PointMarker">
<Setter.Value>
<s3D:PyramidPointMarker3D Fill="PowderBlue"
Size="2"
Opacity="1"/>
</Setter.Value>
</Setter>
</Style>
</ResourceDictionary>ViewModel3DFactory.cs
View source codeusing System;
using System.Windows.Media;
using SciChart.Charting3D.Model;
using SciChart.Charting3D.Model.ChartSeries;
using SciChart.Charting3D.Model.DataSeries.Waterfall;
using SciChart.Charting3D.Visuals.RenderableSeries;
using SciChart.Examples.ExternalDependencies.Data;
namespace SciChart.Examples.Examples.Charts3D.ManipulateSeries3DMVVM
{
public static class ViewModelFactory3D
{
private static readonly Random _random = new Random(251916);
private static FFT2 _transform = new FFT2();
public static IRenderableSeries3DViewModel New(string typeName)
{
Type type = GetViewModelType(typeName);
if (type == typeof(ColumnRenderableSeries3DViewModel))
{
return new ColumnRenderableSeries3DViewModel { DataSeries = GetDataSeries(), StyleKey = "ColumnStyle3D" };
}
if (type == typeof(ImpulseRenderableSeries3DViewModel))
{
return new ImpulseRenderableSeries3DViewModel { DataSeries = GetDataSeries(), StyleKey = "Impulse3DStyle" };
}
if (type == typeof(PointLineRenderableSeries3DViewModel))
{
return new PointLineRenderableSeries3DViewModel { DataSeries = GetScaledDataSeries(), StyleKey = "PointLine3DStyle" };
}
if (type == typeof(SurfaceMeshRenderableSeries3DViewModel))
{
return new SurfaceMeshRenderableSeries3DViewModel { DataSeries = GetSurfaceMeshDataSeries(), StyleKey = "SurfaceMeshStyle" };
}
if (type == typeof(ScatterRenderableSeries3DViewModel))
{
return new ScatterRenderableSeries3DViewModel { DataSeries = GetScaledDataSeries(), StyleKey = "Scatter3DStyle" };
}
if (type == typeof(WaterfallRenderableSeries3DViewModel))
{
return new WaterfallRenderableSeries3DViewModel { DataSeries = GetWaterfallDataSeries(), StyleKey = "WaterfallStyle" };
}
throw new NotImplementedException("Unsupported Series Type.");
}
private static XyzDataSeries3D<double> GetDataSeries()
{
var xyzDataSeries3D = new XyzDataSeries3D<double>();
for (var i = 1; i < 15; i++)
{
for (var j = 1; j <= 15; j++)
{
if (i != j && i % 3 == 0 && j % 3 == 0)
{
var x = DataManager.Instance.GetGaussianRandomNumber(40, 19);
var y = DataManager.Instance.GetGaussianRandomNumber(5, 1.5);
var z = DataManager.Instance.GetGaussianRandomNumber(10, 5);
var randomColor = Color.FromArgb(0xFF, (byte)_random.Next(1, 255), (byte)_random.Next(0, 255), (byte)_random.Next(0, 255));
xyzDataSeries3D.Append(x, y, z, new PointMetadata3D(randomColor));
}
}
}
return xyzDataSeries3D;
}
private static XyzDataSeries3D<double> GetScaledDataSeries()
{
var xyzDataSeries3D = new XyzDataSeries3D<double>();
const int count = 250;
var random = new Random(0);
for (var i = 0; i < count; i++)
{
var x = DataManager.Instance.GetGaussianRandomNumber(40, 19);
var y = DataManager.Instance.GetGaussianRandomNumber(5, 1.5);
var z = DataManager.Instance.GetGaussianRandomNumber(10, 5);
var scale = (float)((random.NextDouble() + 0.5) * 3.0);
Color? randomColor = Color.FromArgb(0xFF, (byte)random.Next(50, 255), (byte)random.Next(50, 255), (byte)random.Next(50, 255));
xyzDataSeries3D.Append(x, y, z, new PointMetadata3D(randomColor, scale));
}
return xyzDataSeries3D;
}
private static UniformGridDataSeries3D<double> GetSurfaceMeshDataSeries()
{
var meshDataSeries = new UniformGridDataSeries3D<double>(80, 25) { StepX = 1, StepZ = 1 };
for (int x = 0; x < 80; x++)
{
for (int z = 0; z < 25; z++)
{
var s = DataManager.Instance.GetGaussianRandomNumber(100, 100);
double y = Math.Sin(x * 0.2 * s) / ((z + 1) * 2);
y = y >= 0 ? y : 0;
meshDataSeries[z, x] = y * Math.Abs(s);
}
}
return meshDataSeries;
}
private static WaterfallDataSeries3D<double> GetWaterfallDataSeries()
{
var pointsPerSlice = 100;
var sliceCount = 20;
var logBase = 10;
var slicePositions = new double[sliceCount];
for (int i = 0; i < sliceCount; ++i)
{
slicePositions[i] = i;
}
var dataSeries = new WaterfallDataSeries3D<double>(pointsPerSlice, slicePositions);
dataSeries.StartX = 10;
dataSeries.StepX = 1;
_transform.init((uint)Math.Log(pointsPerSlice, 2));
var count = pointsPerSlice * 2;
var re = new double[count];
var im = new double[count];
for (int sliceIndex = 0; sliceIndex < sliceCount; ++sliceIndex)
{
for (var i = 0; i < count; i++)
{
re[i] = 2.0 * Math.Sin(2 * Math.PI * i / 20) +
5 * Math.Sin(2 * Math.PI * i / 10) +
2.0 * _random.NextDouble();
im[i] = -10;
}
_transform.run(re, im);
var scaleCoef = Math.Pow(1.5, sliceIndex * 0.3) / Math.Pow(1.5, sliceCount * 0.3);
for (var pointIndex = 0; pointIndex < pointsPerSlice; pointIndex++)
{
var mag = Math.Sqrt(re[pointIndex] * re[pointIndex] + im[pointIndex] * im[pointIndex]);
var yVal = _random.Next(10, 20) * Math.Log10(mag / pointsPerSlice);
yVal = (yVal < -25 || yVal > -5)
? (yVal < -25) ? -25 : _random.Next(-6, -3)
: yVal;
dataSeries[sliceIndex, pointIndex] = -yVal * scaleCoef;
}
}
return dataSeries;
}
private static Type GetViewModelType(string seriesType)
{
if (seriesType.Equals("Column Series"))
{
return typeof(ColumnRenderableSeries3DViewModel);
}
if (seriesType.Equals("Impulse Series"))
{
return typeof(ImpulseRenderableSeries3DViewModel);
}
if (seriesType.Equals("PointLine Series"))
{
return typeof(PointLineRenderableSeries3DViewModel);
}
if (seriesType.Equals("SurfaceMesh Series"))
{
return typeof(SurfaceMeshRenderableSeries3DViewModel);
}
if (seriesType.Equals("Waterfall Series"))
{
return typeof(WaterfallRenderableSeries3DViewModel);
}
if (seriesType.Equals("Scatter Series"))
{
return typeof(ScatterRenderableSeries3DViewModel);
}
throw new ArgumentException("Not supported type!");
}
}
}