WPF Chart - Examples
SciChart WPF ships with hundreds of WPF Chart Examples which you can browse, play with, view the source-code and even export each WPF Chart Example to a stand-alone Visual Studio solution. All of this is possible with the new and improved SciChart WPF Examples Suite, which ships as part of the SciChart WPF SDK.
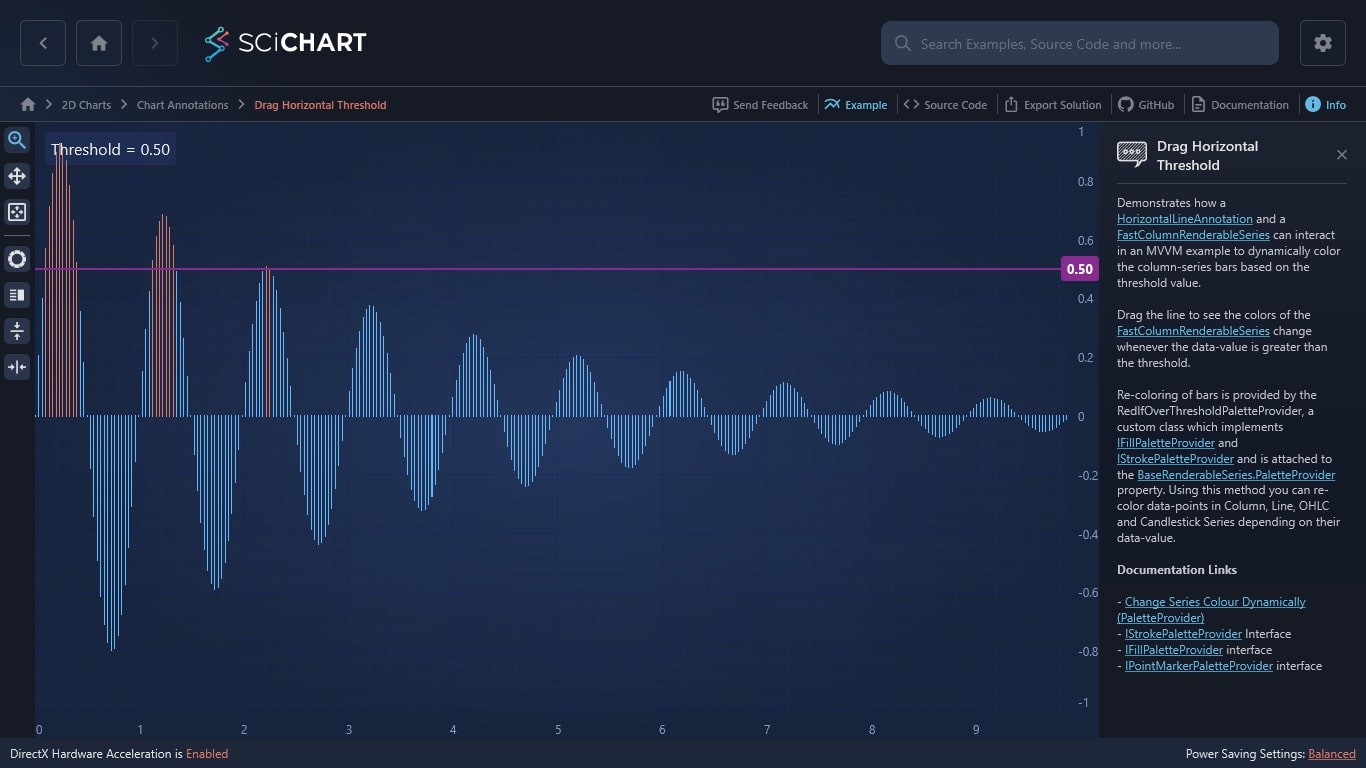
Demonstrates how a HorizontalLineAnnotation and a FastColumnRenderableSeries can interact in an MVVM example to dynamically color the column-series bars based on the threshold value.
Drag the line to see the colors of the FastColumnRenderableSeries change whenever the data-value is greater than the threshold.
Re-coloring of bars is provided by the RedIfOverThresholdPaletteProvider, a custom class which implements IFillPaletteProvider and IStrokePaletteProvider and is attached to the BaseRenderableSeries.PaletteProvider property. Using this method you can re-color data-points in Column, Line, OHLC and Candlestick Series depending on their data-value.
Documentation Links
– Change Series Colour Dynamically (PaletteProvider)
– IStrokePaletteProvider Interface
– IFillPaletteProvider interface
– IPointMarkerPaletteProvider interface

The C#/WPF source code for the WPF Chart Drag Horizontal Threshold example is included below (Scroll down!).
Did you know you can also view the source code from one of the following sources as well?
- Clone the SciChart.WPF.Examples from Github.
- Or, view source in the SciChart WPF Examples suite.
- Also the SciChart WPF Trial contains the full source for the examples (link below).
DragThresholdMvvm.xaml
View source code<UserControl x:Class="SciChart.Examples.Examples.AnnotateAChart.DragHorizontalThreshold.DragAnnotationsMvvm"
xmlns="http://schemas.microsoft.com/winfx/2006/xaml/presentation"
xmlns:x="http://schemas.microsoft.com/winfx/2006/xaml"
xmlns:d="http://schemas.microsoft.com/expression/blend/2008"
xmlns:ext="http://schemas.abtsoftware.co.uk/scichart/exampleExternals"
xmlns:mc="http://schemas.openxmlformats.org/markup-compatibility/2006"
xmlns:s="http://schemas.abtsoftware.co.uk/scichart"
d:DesignHeight="400"
d:DesignWidth="600"
mc:Ignorable="d">
<UserControl.Resources>
<!-- Placement of overlay text, displaying threshold -->
<ControlTemplate x:Key="LegendTemplate">
<Border HorizontalAlignment="Left"
VerticalAlignment="Top"
Background="#88444444"
BorderBrush="#88EEEEEE"
BorderThickness="1"
CornerRadius="3">
<TextBlock Margin="5"
FontSize="16"
Foreground="#eee"
Text="{Binding DataContext.Threshold,
StringFormat='Threshold = {0:#0.00}',
RelativeSource={RelativeSource AncestorType=s:SciChartSurface}}" />
</Border>
</ControlTemplate>
<!-- this is only included so the designer will work. In the example we bind to ViewportManager property in a ViewModel -->
<!-- so that we can control the chart from the ViewModel. Another way to solve this problem is to have a design time viewmodel -->
<s:DefaultViewportManager x:Key="DefaultViewportManager" />
</UserControl.Resources>
<Grid>
<Grid.ColumnDefinitions>
<ColumnDefinition Width="Auto" />
<ColumnDefinition Width="*" />
</Grid.ColumnDefinitions>
<!-- The SciChartInteractionToolbar adds zoom, pan, zoom extents and rotate functionality -->
<!-- to the chart and is included for example purposes. -->
<!-- If you wish to know how to zoom and pan a chart then do a search for Zoom Pan in the Examples suite! -->
<ext:SciChartInteractionToolbar TargetSurface="{Binding Source={x:Reference Name=sciChart}}">
<ext:FlyoutMenuButton Content="AXIS"
Padding="0"
Style="{StaticResource FlyoutMenuButtonStyle}">
<ext:FlyoutMenuButton.PopupContent>
<StackPanel MinWidth="150"
Margin="0,0,0,4"
Orientation="Vertical">
<TextBlock Text="YAxis.AxisAlignment" />
<ext:FlyoutSeparator />
<ComboBox x:Name="cboYAxisAlignment"
Margin="4"
SelectedIndex="0">
<ComboBox.Items>
<s:AxisAlignment>Right</s:AxisAlignment>
<s:AxisAlignment>Left</s:AxisAlignment>
</ComboBox.Items>
</ComboBox>
<TextBlock Text="Xaxis.AxisAlignment" />
<ext:FlyoutSeparator />
<ComboBox x:Name="cboXAxisAlignment"
Margin="4"
SelectedIndex="0">
<ComboBox.Items>
<s:AxisAlignment>Bottom</s:AxisAlignment>
<s:AxisAlignment>Top</s:AxisAlignment>
</ComboBox.Items>
</ComboBox>
</StackPanel>
</ext:FlyoutMenuButton.PopupContent>
</ext:FlyoutMenuButton>
</ext:SciChartInteractionToolbar>
<!-- We declare a SciChartSurface -->
<!-- The ViewModel is the DragThresholdMvvmViewModel, which is assigned by the examples suite to the View.DataContext -->
<s:SciChartSurface x:Name="sciChart"
Grid.Column="1"
BorderThickness="0"
Padding="0"
ViewportManager="{Binding ViewportManager,
Mode=OneWay,
FallbackValue={StaticResource DefaultViewportManager}}">
<s:SciChartSurface.RenderableSeries>
<s:FastColumnRenderableSeries DataPointWidth="0.2"
DataSeries="{Binding ColumnDataSeries}"
PaletteProvider="{Binding ThresholdPaletteProvider}" />
</s:SciChartSurface.RenderableSeries>
<s:SciChartSurface.XAxis>
<s:NumericAxis AxisAlignment="{Binding Source={x:Reference Name=cboXAxisAlignment}, Path=SelectedItem}"
DrawMajorBands="True" />
</s:SciChartSurface.XAxis>
<s:SciChartSurface.YAxis>
<s:NumericAxis AxisAlignment="{Binding Source={x:Reference Name=cboYAxisAlignment}, Path=SelectedItem}"
DrawMajorBands="True"
VisibleRange="-1.0, 1.0" />
</s:SciChartSurface.YAxis>
<s:SciChartSurface.Annotations>
<s:HorizontalLineAnnotation HorizontalAlignment="Stretch"
FontSize="13"
FontWeight="Bold"
Foreground="White"
IsEditable="True"
LabelPlacement="Axis"
LabelTextFormatting="0.00"
ShowLabel="True"
Stroke="#FF42b649"
StrokeThickness="2"
Y1="{Binding Threshold,
Mode=TwoWay,
FallbackValue=0.5}" />
</s:SciChartSurface.Annotations>
<s:SciChartSurface.ChartModifier>
<s:LegendModifier Margin="10"
LegendTemplate="{StaticResource LegendTemplate}"
ShowLegend="True" />
</s:SciChartSurface.ChartModifier>
</s:SciChartSurface>
</Grid>
</UserControl>
DragThresholdMvvm.xaml.cs
View source code// *************************************************************************************
// SCICHART® Copyright SciChart Ltd. 2011-2022. All rights reserved.
//
// Web: http://www.scichart.com
// Support: support@scichart.com
// Sales: sales@scichart.com
//
// DragThresholdMvvm.xaml.cs is part of the SCICHART® Examples. Permission is hereby granted
// to modify, create derivative works, distribute and publish any part of this source
// code whether for commercial, private or personal use.
//
// The SCICHART® examples are distributed in the hope that they will be useful, but
// without any warranty. It is provided "AS IS" without warranty of any kind, either
// expressed or implied.
// *************************************************************************************
using System.Windows.Controls;
namespace SciChart.Examples.Examples.AnnotateAChart.DragHorizontalThreshold
{
/// <summary>
/// Interaction logic for DragAnnotationsMvvm.xaml
/// </summary>
public partial class DragAnnotationsMvvm : UserControl
{
public DragAnnotationsMvvm()
{
InitializeComponent();
}
}
}
DragThresholdMvvmViewModel.cs
View source code// *************************************************************************************
// SCICHART® Copyright SciChart Ltd. 2011-2022. All rights reserved.
//
// Web: http://www.scichart.com
// Support: support@scichart.com
// Sales: sales@scichart.com
//
// DragThresholdMvvmViewModel.cs is part of the SCICHART® Examples. Permission is hereby granted
// to modify, create derivative works, distribute and publish any part of this source
// code whether for commercial, private or personal use.
//
// The SCICHART® examples are distributed in the hope that they will be useful, but
// without any warranty. It is provided "AS IS" without warranty of any kind, either
// expressed or implied.
// *************************************************************************************
using SciChart.Charting.Model.DataSeries;
using SciChart.Charting.ViewportManagers;
using SciChart.Charting.Visuals.PaletteProviders;
using SciChart.Examples.ExternalDependencies.Common;
using SciChart.Examples.ExternalDependencies.Data;
namespace SciChart.Examples.Examples.AnnotateAChart.DragHorizontalThreshold
{
public class DragThresholdMvvmViewModel : BaseViewModel
{
private readonly RedIfOverThresholdPaletteProvider _paletteProvider;
public DragThresholdMvvmViewModel()
{
ColumnDataSeries = new UniformXyDataSeries<double>(0d, 0.033);
ColumnDataSeries.Append(DataManager.Instance.GetDampedSinewaveYData(1.0, 0.01, 300));
_paletteProvider = new RedIfOverThresholdPaletteProvider();
Threshold = 0.5;
}
public IViewportManager ViewportManager { get; } = new DefaultViewportManager();
// We use a PaletteProvider type to override render colors for the column depending on threshold
public IPaletteProvider ThresholdPaletteProvider => _paletteProvider;
// We expose a DataSeries that is bound to in the view to RenderableSeries.DataSeriesProperty
public IUniformXyDataSeries<double> ColumnDataSeries { get; private set; }
/// <summary>
/// We bind to Threshold in the view. This is the Y-value of the horizontal line. We pass through the value to the PaletteProvider, which
/// alters the color of columns on render
/// </summary>
public double Threshold
{
get => _paletteProvider.Threshold;
set
{
_paletteProvider.Threshold = value;
ViewportManager.InvalidateParentSurface(RangeMode.None);
OnPropertyChanged(nameof(Threshold));
}
}
}
}RedIfOverThresholdPaletteProvider.cs
View source code// *************************************************************************************
// SCICHART® Copyright SciChart Ltd. 2011-2022. All rights reserved.
//
// Web: http://www.scichart.com
// Support: support@scichart.com
// Sales: sales@scichart.com
//
// RedIfOverThresholdPaletteProvider.cs is part of the SCICHART® Examples. Permission is hereby granted
// to modify, create derivative works, distribute and publish any part of this source
// code whether for commercial, private or personal use.
//
// The SCICHART® examples are distributed in the hope that they will be useful, but
// without any warranty. It is provided "AS IS" without warranty of any kind, either
// expressed or implied.
// *************************************************************************************
using System.Collections.Generic;
using System.Windows.Media;
using SciChart.Charting.Model.DataSeries;
using SciChart.Charting.Visuals.PaletteProviders;
using SciChart.Charting.Visuals.RenderableSeries;
namespace SciChart.Examples.Examples.AnnotateAChart.DragHorizontalThreshold
{
/// <summary>
/// Defines a paletter provider to return a red color if the Y-Value is over a threshold value
/// </summary>
public class RedIfOverThresholdPaletteProvider : IStrokePaletteProvider, IFillPaletteProvider
{
private readonly Color _overriddenColor;
private readonly Brush _overriddenFill;
private IList<double> _yValues;
public RedIfOverThresholdPaletteProvider()
{
_overriddenColor = Color.FromArgb(0xFF, 0xFF, 0x33, 0x33);
_overriddenFill = new SolidColorBrush(_overriddenColor);
}
public double Threshold { get; set; }
public Color? OverrideStrokeColor(IRenderableSeries series, int index, IPointMetadata metadata)
{
if (_yValues[index] > Threshold)
{
var color = _overriddenColor;
color.A = (byte) (_overriddenColor.A * series.Opacity);
return color;
}
// Returning null means use the default color when rendering
return null;
}
public Brush OverrideFillBrush(IRenderableSeries series, int index, IPointMetadata metadata)
{
if (_yValues[index] > Threshold)
{
var colorBrush = _overriddenFill;
colorBrush.Opacity *= series.Opacity;
return colorBrush;
}
// Returning null means use the default color when rendering
return null;
}
public void OnBeginSeriesDraw(IRenderableSeries series)
{
_yValues = ((IUniformXyDataSeries<double>)series.DataSeries).YValues;
}
}
}
