WPF Chart - Examples
SciChart WPF ships with hundreds of WPF Chart Examples which you can browse, play with, view the source-code and even export each WPF Chart Example to a stand-alone Visual Studio solution. All of this is possible with the new and improved SciChart WPF Examples Suite, which ships as part of the SciChart WPF SDK.
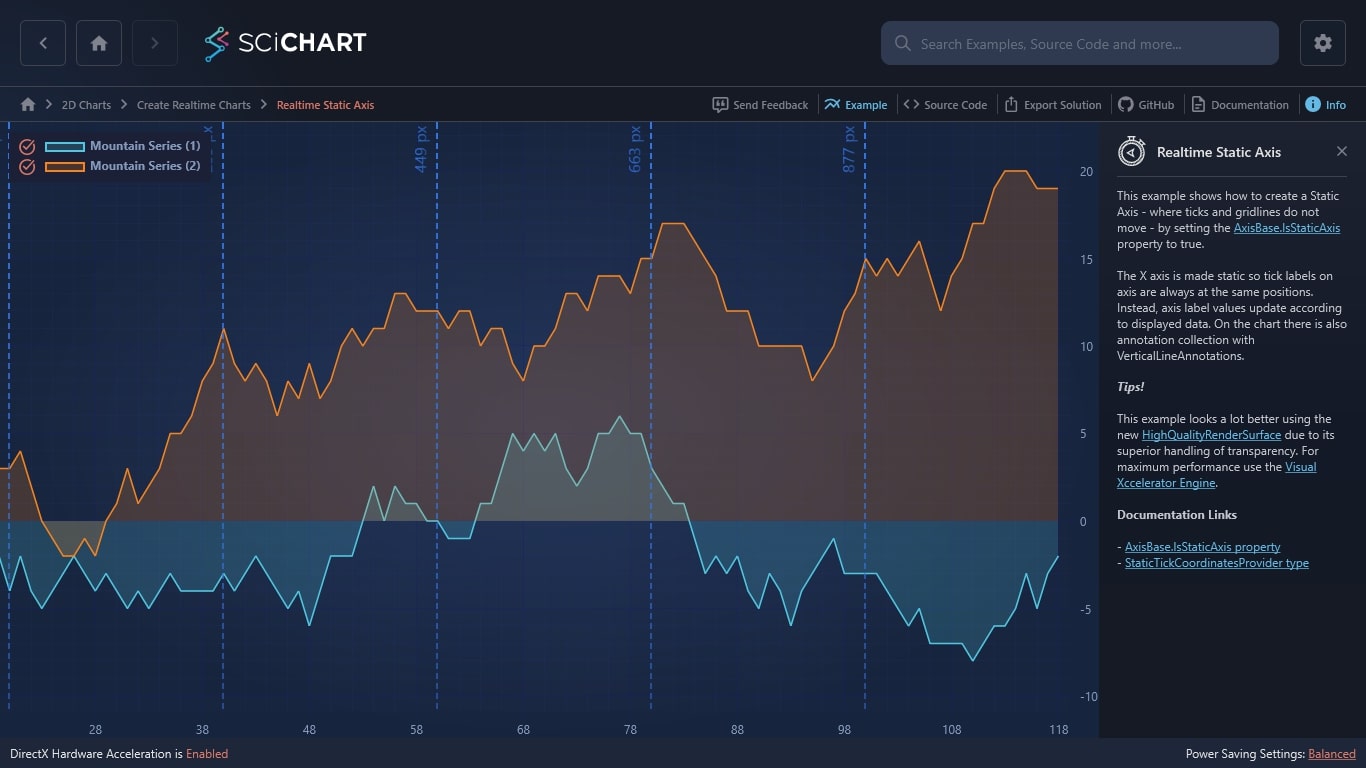
This example shows how to create a Static Axis – where ticks and gridlines do not move – by setting the AxisBase.IsStaticAxis property to true.
The X axis is made static so tick labels on axis are always at the same positions. Instead, axis label values update according to displayed data. On the chart there is also annotation collection with VerticalLineAnnotations.
Tips!
This example looks a lot better using the new HighQualityRenderSurface due to its superior handling of transparency. For maximum performance use the Visual Xccelerator Engine.
Documentation Links
– AxisBase.IsStaticAxis property
– StaticTickCoordinatesProvider type

The C#/WPF source code for the WPF Chart Realtime Static Axis example is included below (Scroll down!).
Did you know you can also view the source code from one of the following sources as well?
- Clone the SciChart.WPF.Examples from Github.
- Or, view source in the SciChart WPF Examples suite.
- Also the SciChart WPF Trial contains the full source for the examples (link below).
RealTimeStaticAxis.xaml
View source code<UserControl x:Class="SciChart.Examples.Examples.CreateRealtimeChart.RealTimeStaticAxis.RealTimeStaticAxis"
xmlns="http://schemas.microsoft.com/winfx/2006/xaml/presentation"
xmlns:x="http://schemas.microsoft.com/winfx/2006/xaml"
xmlns:d="http://schemas.microsoft.com/expression/blend/2008"
xmlns:local="clr-namespace:SciChart.Examples.Examples.CreateRealtimeChart.RealTimeStaticAxis"
xmlns:mc="http://schemas.openxmlformats.org/markup-compatibility/2006"
xmlns:s="http://schemas.abtsoftware.co.uk/scichart"
Loaded="OnExampleLoaded"
Unloaded="OnExampleUnloaded"
d:DesignHeight="400"
d:DesignWidth="600"
mc:Ignorable="d">
<UserControl.Resources>
<local:AnnotationGetXCoordinateConverter x:Key="ToCoordinateConverter" />
<Style x:Key="AnnotationStyle" TargetType="s:VerticalLineAnnotation">
<Setter Property="ShowLabel" Value="True" />
<Setter Property="LabelPlacement" Value="TopLeft" />
<Setter Property="LabelValue" Value="{Binding ., RelativeSource={RelativeSource Self}, Converter={StaticResource ToCoordinateConverter}}" />
<Setter Property="FontSize" Value="16" />
<Setter Property="Stroke">
<Setter.Value>
<LinearGradientBrush StartPoint="0,0" EndPoint="0,1">
<GradientStop Offset="0" Color="#FF3376E5" />
<GradientStop Offset="1" Color="#773376E5" />
</LinearGradientBrush>
</Setter.Value>
</Setter>
<Setter Property="StrokeThickness" Value="2" />
<Setter Property="StrokeDashArray" Value="3 2" />
</Style>
</UserControl.Resources>
<Grid>
<s:SciChartSurface Name="sciChart">
<s:SciChartSurface.RenderableSeries>
<s:FastMountainRenderableSeries x:Name="mountainRenderableSeries1"
Stroke="#FF3376E5"
StrokeThickness="2">
<s:FastMountainRenderableSeries.Fill>
<LinearGradientBrush StartPoint="0,0" EndPoint="0,1">
<GradientStop Offset="0" Color="#A83376E5" />
<GradientStop Offset="1" Color="#333376E5" />
</LinearGradientBrush>
</s:FastMountainRenderableSeries.Fill>
</s:FastMountainRenderableSeries>
<s:FastMountainRenderableSeries x:Name="mountainRenderableSeries2"
Stroke="#FF39E345"
StrokeThickness="2">
<s:FastMountainRenderableSeries.Fill>
<LinearGradientBrush StartPoint="0,0" EndPoint="0,1">
<GradientStop Offset="0" Color="#A839E345" />
<GradientStop Offset="1" Color="#3339E345" />
</LinearGradientBrush>
</s:FastMountainRenderableSeries.Fill>
</s:FastMountainRenderableSeries>
</s:SciChartSurface.RenderableSeries>
<s:SciChartSurface.XAxis>
<s:NumericAxis Name="xAxis"
AutoRange="Always"
GrowBy="0,0.01"
IsStaticAxis="True" />
</s:SciChartSurface.XAxis>
<s:SciChartSurface.YAxis>
<s:NumericAxis AutoRange="Always" GrowBy="0.1,0.1" />
</s:SciChartSurface.YAxis>
<s:SciChartSurface.Annotations>
<s:VerticalLineAnnotation Style="{StaticResource AnnotationStyle}" X1="0" />
<s:VerticalLineAnnotation Style="{StaticResource AnnotationStyle}" X1="20" />
<s:VerticalLineAnnotation Style="{StaticResource AnnotationStyle}" X1="40" />
<s:VerticalLineAnnotation Style="{StaticResource AnnotationStyle}" X1="60" />
<s:VerticalLineAnnotation Style="{StaticResource AnnotationStyle}" X1="80" />
<s:VerticalLineAnnotation Style="{StaticResource AnnotationStyle}" X1="100" />
</s:SciChartSurface.Annotations>
<s:SciChartSurface.ChartModifier>
<s:LegendModifier Name="legendModifier"
Margin="10"
ShowLegend="True" />
</s:SciChartSurface.ChartModifier>
</s:SciChartSurface>
</Grid>
</UserControl>
RealTimeStaticAxis.xaml.cs
View source code// *************************************************************************************
// SCICHART® Copyright SciChart Ltd. 2011-2022. All rights reserved.
//
// Web: http://www.scichart.com
// Support: support@scichart.com
// Sales: sales@scichart.com
//
// RealTimeStaticAxis.xaml.cs is part of the SCICHART® Examples. Permission is hereby granted
// to modify, create derivative works, distribute and publish any part of this source
// code whether for commercial, private or personal use.
//
// The SCICHART® examples are distributed in the hope that they will be useful, but
// without any warranty. It is provided "AS IS" without warranty of any kind, either
// expressed or implied.
// *************************************************************************************
using System;
using System.Linq;
using System.Windows;
using System.Windows.Controls;
using System.Windows.Threading;
using SciChart.Charting.Model.DataSeries;
using SciChart.Charting.Visuals.Annotations;
namespace SciChart.Examples.Examples.CreateRealtimeChart.RealTimeStaticAxis
{
/// <summary>
/// Interaction logic for RealTimeStaticAxis.xaml
/// </summary>
public partial class RealTimeStaticAxis : UserControl
{
private DispatcherTimer _timer;
// A drop in replacement for System.Random which is 3x faster: https://www.codeproject.com/Articles/9187/A-fast-equivalent-for-System-Random
private readonly Random _random = new Random();
private int _annotationCoord;
private int _dataPoint1, _dataPoint2;
private const int FifoCapacity = 100;
private const int Interval = 100;
public RealTimeStaticAxis()
{
InitializeComponent();
mountainRenderableSeries1.DataSeries = new XyDataSeries<double, double>
{
FifoCapacity = FifoCapacity,
SeriesName = "Mountain Series (1)"
};
mountainRenderableSeries2.DataSeries = new XyDataSeries<double, double>
{
FifoCapacity = FifoCapacity,
SeriesName = "Mountain Series (2)"
};
}
private int GenerateNextDataPoint(int preveiousValue)
{
var newValue = _random.Next(preveiousValue - 2, preveiousValue + 3);
newValue = Math.Min(20, newValue);
newValue = Math.Max(-20, newValue);
return newValue;
}
private void TimerOnElapsed(object sender, EventArgs e)
{
_dataPoint1 = GenerateNextDataPoint(_dataPoint1);
_dataPoint2 = GenerateNextDataPoint(_dataPoint2);
((XyDataSeries<double, double>)mountainRenderableSeries1.DataSeries).Append(_annotationCoord, _dataPoint1);
((XyDataSeries<double, double>)mountainRenderableSeries2.DataSeries).Append(_annotationCoord, _dataPoint2);
UpdateLineAnnotations();
_annotationCoord ++;
}
private void UpdateLineAnnotations()
{
var updatePos = _annotationCoord != 0 && _annotationCoord % 20 == 0;
foreach (var annotation in sciChart.Annotations.OfType<VerticalLineAnnotation>())
{
// update position of annotation to show it again if annotation is ouside of view port
if (xAxis.VisibleRange != null && updatePos && annotation.X1.CompareTo(xAxis.VisibleRange.Min) < 0)
{
annotation.X1 = (double)_annotationCoord;
updatePos = false;
}
UpdateLabel(annotation);
}
}
private void UpdateLabel(VerticalLineAnnotation annotation)
{
var expr = annotation.GetBindingExpression(LineAnnotationWithLabelsBase.LabelValueProperty);
if (expr != null)
{
var binding = expr.ParentBinding;
annotation.SetBinding(LineAnnotationWithLabelsBase.LabelValueProperty, binding);
}
}
private void OnExampleLoaded(object sender, RoutedEventArgs e)
{
// Preload with data
for (int i = 0; i < FifoCapacity; i++)
{
TimerOnElapsed(null, EventArgs.Empty);
}
if (_timer == null)
{
_timer = new DispatcherTimer(DispatcherPriority.Background);
_timer.Interval = TimeSpan.FromMilliseconds(Interval);
_timer.Tick += TimerOnElapsed;
_timer.Start();
}
}
private void OnExampleUnloaded(object sender, RoutedEventArgs e)
{
if (_timer != null)
{
_timer.Stop();
_timer.Tick -= TimerOnElapsed;
_timer = null;
}
}
}
}
AnnotationGetXCoordinateConverter.cs
View source code// *************************************************************************************
// SCICHART® Copyright SciChart Ltd. 2011-2022. All rights reserved.
//
// Web: http://www.scichart.com
// Support: support@scichart.com
// Sales: sales@scichart.com
//
// AnnotationGetXCoordinateConverter.cs is part of the SCICHART® Examples. Permission is hereby granted
// to modify, create derivative works, distribute and publish any part of this source
// code whether for commercial, private or personal use.
//
// The SCICHART® examples are distributed in the hope that they will be useful, but
// without any warranty. It is provided "AS IS" without warranty of any kind, either
// expressed or implied.
// *************************************************************************************
using System;
using System.Globalization;
using System.Windows.Data;
using SciChart.Charting.Visuals.Annotations;
namespace SciChart.Examples.Examples.CreateRealtimeChart.RealTimeStaticAxis
{
public class AnnotationGetXCoordinateConverter:IValueConverter
{
public object Convert(object value, Type targetType, object parameter, CultureInfo culture)
{
var annotation = value as AnnotationBase;
var xAxis = annotation.XAxis;
var result = annotation.X1;
if (xAxis != null && result != null)
{
var xCoordCalculator = xAxis.GetCurrentCoordinateCalculator();
var position = xCoordCalculator == null ? (double)result : xCoordCalculator.GetCoordinate((double)result);
position = Math.Round(position);
result = position.ToString(culture) + " px";
}
return result;
}
public object ConvertBack(object value, Type targetType, object parameter, CultureInfo culture)
{
throw new NotImplementedException();
}
}
}
