WPF Chart - Examples
SciChart WPF ships with hundreds of WPF Chart Examples which you can browse, play with, view the source-code and even export each WPF Chart Example to a stand-alone Visual Studio solution. All of this is possible with the new and improved SciChart WPF Examples Suite, which ships as part of the SciChart WPF SDK.
This example shows how to create a Static Axis – where ticks and gridlines do not move – by setting the AxisBase.IsStaticAxis property to true.
The X axis is made static so tick labels on axis are always at the same positions. Instead, axis label values update according to displayed data. On the chart there is also annotation collection with VerticalLineAnnotations.
Tips!
This example looks a lot better using the new HighQualityRenderSurface due to its superior handling of transparency. For maximum performance use the Visual Xccelerator Engine.
Documentation Links
– AxisBase.IsStaticAxis property
– StaticTickCoordinatesProvider type
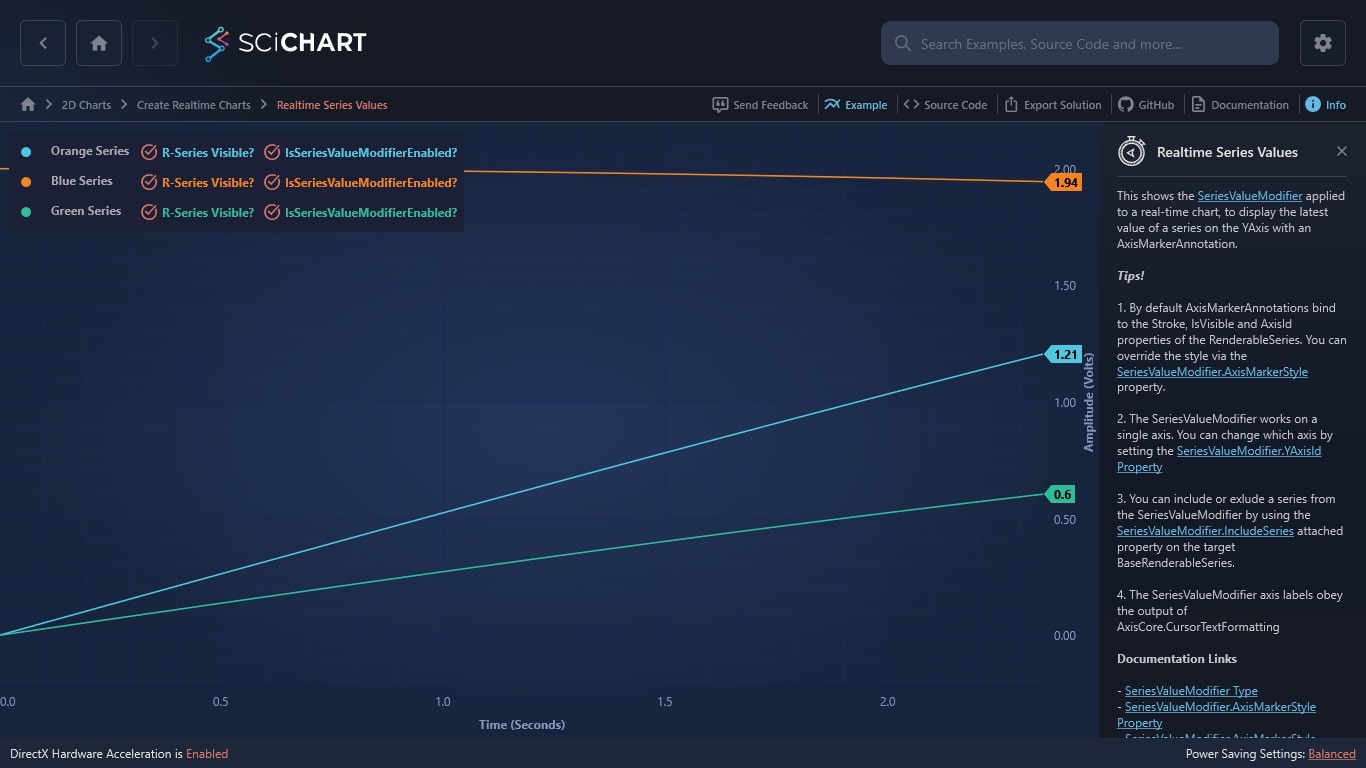
The C#/WPF source code for the WPF Chart Realtime Series Values on Axis example is included below (Scroll down!).
Did you know you can also view the source code from one of the following sources as well?
- Clone the SciChart.WPF.Examples from Github.
- Or, view source in the SciChart WPF Examples suite.
- Also the SciChart WPF Trial contains the full source for the examples (link below).


