WPF Chart - Examples
SciChart WPF ships with hundreds of WPF Chart Examples which you can browse, play with, view the source-code and even export each WPF Chart Example to a stand-alone Visual Studio solution. All of this is possible with the new and improved SciChart WPF Examples Suite, which ships as part of the SciChart WPF SDK.
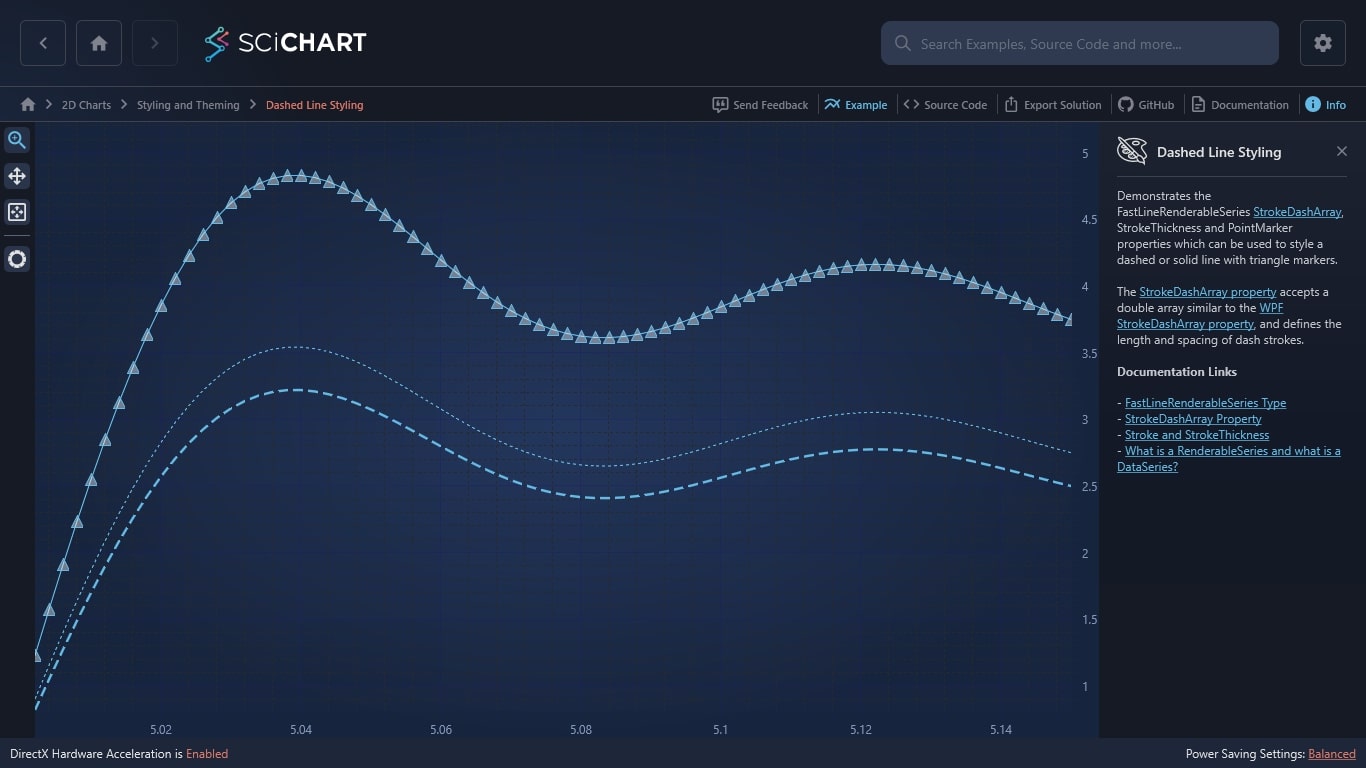
Demonstrates the FastLineRenderableSeries StrokeDashArray, StrokeThickness and PointMarker properties which can be used to style a dashed or solid line with triangle markers.
The StrokeDashArray property accepts a double array similar to the WPF StrokeDashArray property, and defines the length and spacing of dash strokes.
Documentation Links
– FastLineRenderableSeries Type
– StrokeDashArray Property
– Stroke and StrokeThickness
– What is a RenderableSeries and what is a DataSeries?

The C#/WPF source code for the WPF Chart Dashed Line Styling example is included below (Scroll down!).
Did you know you can also view the source code from one of the following sources as well?
- Clone the SciChart.WPF.Examples from Github.
- Or, view source in the SciChart WPF Examples suite.
- Also the SciChart WPF Trial contains the full source for the examples (link below).
LineSeriesStyling.xaml
View source code<UserControl x:Class="SciChart.Examples.Examples.StyleAChart.LineSeriesStyling"
xmlns="http://schemas.microsoft.com/winfx/2006/xaml/presentation"
xmlns:x="http://schemas.microsoft.com/winfx/2006/xaml"
xmlns:s="http://schemas.abtsoftware.co.uk/scichart"
xmlns:local="clr-namespace:SciChart.Examples.Examples.StyleAChart"
xmlns:mc="http://schemas.openxmlformats.org/markup-compatibility/2006"
xmlns:d="http://schemas.microsoft.com/expression/blend/2008"
xmlns:ext="http://schemas.abtsoftware.co.uk/scichart/exampleExternals"
d:DesignHeight="400"
d:DesignWidth="600"
mc:Ignorable="d">
<UserControl.Resources>
<local:LineSeriesStylingViewModel x:Key="vm" />
<Style x:Key="DashedGridLinesStyle" TargetType="Line">
<Setter Property="Stroke" Value="#292929" />
<Setter Property="StrokeThickness" Value="1" />
<Setter Property="StrokeDashArray" Value="3 3" />
</Style>
</UserControl.Resources>
<Grid DataContext="{StaticResource vm}">
<Grid.ColumnDefinitions>
<ColumnDefinition Width="Auto" />
<ColumnDefinition Width="*" />
</Grid.ColumnDefinitions>
<!-- The SciChartInteractionToolbar adds zoom, pan, zoom extents and rotate functionality -->
<!-- to the chart and is included for example purposes. -->
<!-- If you wish to know how to zoom and pan a chart then do a search for Zoom Pan in the Examples suite! -->
<ext:SciChartInteractionToolbar TargetSurface="{Binding Source={x:Reference Name=sciChart}}" />
<s:SciChartSurface x:Name="sciChart" Grid.Column="1">
<s:SciChartSurface.RenderableSeries>
<!-- Demonstrates a thick dashed line -->
<s:FastLineRenderableSeries Name="Series0"
AntiAliasing="True"
DataSeries="{Binding Series0}"
StrokeDashArray="10,5"
StrokeThickness="3" />
<!-- Demonstrates a 1pixel dashed line -->
<s:FastLineRenderableSeries Name="Series1"
AntiAliasing="True"
DataSeries="{Binding Series1}"
StrokeDashArray="3,3"
StrokeThickness="1" />
<!-- Demonstrates a line with PointMarker (also see PointMarkers example) -->
<s:FastLineRenderableSeries Name="Series2"
AntiAliasing="True"
DataSeries="{Binding Series2}"
StrokeThickness="1">
<s:FastLineRenderableSeries.PointMarker>
<s:TrianglePointMarker Width="11"
Height="11"
Fill="#66FFFFFF" />
</s:FastLineRenderableSeries.PointMarker>
</s:FastLineRenderableSeries>
</s:SciChartSurface.RenderableSeries>
<s:SciChartSurface.XAxis>
<!-- Define an XAxis with Major Bands and dashed minor gridlines -->
<s:NumericAxis DrawMajorGridLines="True"
DrawMinorGridLines="True"
DrawMinorTicks="True"
MinorGridLineStyle="{StaticResource DashedGridLinesStyle}"
TextFormatting="0.########" />
</s:SciChartSurface.XAxis>
<s:SciChartSurface.YAxis>
<!-- Define an YAxis with Major Bands and dashed minor gridlines -->
<s:NumericAxis DrawMajorBands="True"
DrawMajorGridLines="True"
DrawMinorGridLines="True"
DrawMinorTicks="True"
GrowBy="0.0, 0.1"
MinorGridLineStyle="{StaticResource DashedGridLinesStyle}" />
</s:SciChartSurface.YAxis>
</s:SciChartSurface>
</Grid>
</UserControl>
LineSeriesStyling.xaml.cs
View source code// *************************************************************************************
// SCICHART® Copyright SciChart Ltd. 2011-2022. All rights reserved.
//
// Web: http://www.scichart.com
// Support: support@scichart.com
// Sales: sales@scichart.com
//
// LineSeriesStyling.xaml.cs is part of the SCICHART® Examples. Permission is hereby granted
// to modify, create derivative works, distribute and publish any part of this source
// code whether for commercial, private or personal use.
//
// The SCICHART® examples are distributed in the hope that they will be useful, but
// without any warranty. It is provided "AS IS" without warranty of any kind, either
// expressed or implied.
// *************************************************************************************
using System.Windows.Controls;
namespace SciChart.Examples.Examples.StyleAChart
{
/// <summary>
/// Interaction logic for LineSeriesStyling.xaml
/// </summary>
public partial class LineSeriesStyling : UserControl
{
public LineSeriesStyling()
{
InitializeComponent();
}
}
}
LineSeriesStylingViewModel.cs
View source code// *************************************************************************************
// SCICHART® Copyright SciChart Ltd. 2011-2022. All rights reserved.
//
// Web: http://www.scichart.com
// Support: support@scichart.com
// Sales: sales@scichart.com
//
// LineSeriesStylingViewModel.cs is part of the SCICHART® Examples. Permission is hereby granted
// to modify, create derivative works, distribute and publish any part of this source
// code whether for commercial, private or personal use.
//
// The SCICHART® examples are distributed in the hope that they will be useful, but
// without any warranty. It is provided "AS IS" without warranty of any kind, either
// expressed or implied.
// *************************************************************************************
using System.Linq;
using SciChart.Charting.Model.DataSeries;
using SciChart.Examples.ExternalDependencies.Common;
using SciChart.Examples.ExternalDependencies.Data;
namespace SciChart.Examples.Examples.StyleAChart
{
public class LineSeriesStylingViewModel : BaseViewModel
{
public LineSeriesStylingViewModel()
{
// Generate some data to display
var data = DataManager.Instance.GetFourierSeriesZoomed(1.0, 0.1, 5.0, 5.15);
// Append data to series. SciChart automatically redraws
Series0 = new XyDataSeries<double, double>();
Series1 = new XyDataSeries<double, double>();
Series2 = new XyDataSeries<double, double>();
Series0.Append(data.XData, data.YData);
Series1.Append(data.XData, data.YData.Select(x => x * 1.1));
Series2.Append(data.XData, data.YData.Select(x => x * 1.5));
}
// Note: No need to implement INotifyPropertyChanged here since we're not updating the series instances
public IXyDataSeries<double, double> Series0 { get; private set; }
public IXyDataSeries<double, double> Series1 { get; private set; }
public IXyDataSeries<double, double> Series2 { get; private set; }
}
}
