WPF Chart - Examples
SciChart WPF ships with hundreds of WPF Chart Examples which you can browse, play with, view the source-code and even export each WPF Chart Example to a stand-alone Visual Studio solution. All of this is possible with the new and improved SciChart WPF Examples Suite, which ships as part of the SciChart WPF SDK.
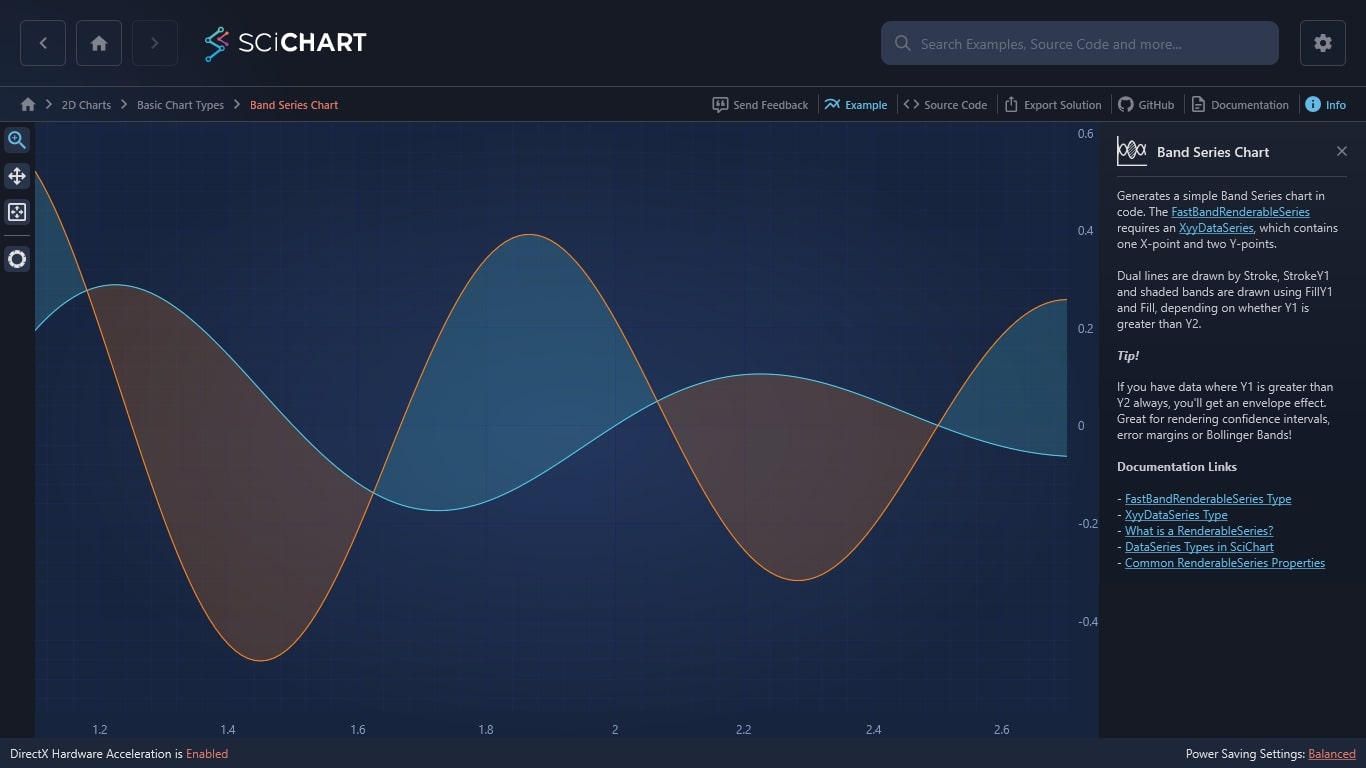
This WPF chart generates a simple Band Series chart in code. The FastBandRenderableSeries requires an XyyDataSeries, which contains one X-point and two Y-points.
Dual lines are drawn by Stroke, StrokeY1 and shaded bands are drawn using FillY1 and Fill, depending on whether Y1 is greater than Y2.
Tip!
If you have data where Y1 is greater than Y2 always, you’ll get an envelope effect. Great for rendering confidence intervals, error margins or Bollinger Bands!
Documentation Links

The C#/WPF source code for the WPF Band Series Chart example is included below (Scroll down!).
Did you know you can also view the source code from one of the following sources as well?
- Clone the SciChart.WPF.Examples from Github.
- Or, view source in the SciChart WPF Examples suite.
- Also the SciChart WPF Trial contains the full source for the examples (link below).
BandSeriesChartExampleView.xaml
View source code<UserControl x:Class="SciChart.Examples.Examples.CreateSimpleChart.BandSeriesChartExampleView"
xmlns="http://schemas.microsoft.com/winfx/2006/xaml/presentation"
xmlns:x="http://schemas.microsoft.com/winfx/2006/xaml"
xmlns:d="http://schemas.microsoft.com/expression/blend/2008"
xmlns:ext="http://schemas.abtsoftware.co.uk/scichart/exampleExternals"
xmlns:mc="http://schemas.openxmlformats.org/markup-compatibility/2006"
xmlns:s="http://schemas.abtsoftware.co.uk/scichart"
Loaded="BandSeriesChartExampleView_OnLoaded"
d:DesignHeight="400"
d:DesignWidth="600"
mc:Ignorable="d">
<UserControl.Resources>
<ResourceDictionary>
<ResourceDictionary.MergedDictionaries>
<ResourceDictionary Source="/SciChart.Examples.ExternalDependencies;component/Resources/Styles/MergedResources.xaml" />
<ResourceDictionary Source="/SciChart.Examples.ExternalDependencies;component/Resources/Styles/ToolbarButtonsCommon.xaml" />
</ResourceDictionary.MergedDictionaries>
</ResourceDictionary>
</UserControl.Resources>
<Grid>
<Grid.ColumnDefinitions>
<ColumnDefinition Width="Auto" />
<ColumnDefinition Width="*" />
</Grid.ColumnDefinitions>
<!-- The SciChartInteractionToolbar adds zoom, pan, zoom extents and rotate functionality -->
<!-- to the chart and is included for example purposes. -->
<!-- If you wish to know how to zoom and pan a chart then do a search for Zoom Pan in the Examples suite! -->
<ext:SciChartInteractionToolbar TargetSurface="{Binding Source={x:Reference Name=sciChart}}"/>
<!-- Create the chart surface -->
<s:SciChartSurface Name="sciChart"
Grid.Column="1"
BorderThickness="0"
Padding="0">
<!-- Declare RenderableSeries -->
<s:SciChartSurface.RenderableSeries>
<s:FastBandRenderableSeries x:Name="bandSeries" Fill="#33279B27"
FillY1="#33FF1919"
Stroke="#FFFF1919"
StrokeY1="#FF279B27">
<s:FastBandRenderableSeries.SeriesAnimation>
<s:WaveAnimation AnimationDelay="0:0:1" Duration="0:0:1" PointDurationFraction="0.2"/>
</s:FastBandRenderableSeries.SeriesAnimation>
</s:FastBandRenderableSeries>
</s:SciChartSurface.RenderableSeries>
<!-- Create an X Axis -->
<s:SciChartSurface.XAxis>
<!-- Note, initial VisibleRange is set for display purposes only. Leave this unset to autorange once on startup -->
<s:NumericAxis x:Name="xAxis"
DrawMajorBands="True"
VisibleRange="1.1, 2.7" />
</s:SciChartSurface.XAxis>
<!-- Create a Y Axis with GrowBy -->
<s:SciChartSurface.YAxis>
<s:NumericAxis x:Name="yAxis" DrawMajorBands="True">
<s:NumericAxis.GrowBy>
<s:DoubleRange Max="0.1" Min="0.1" />
</s:NumericAxis.GrowBy>
</s:NumericAxis>
</s:SciChartSurface.YAxis>
</s:SciChartSurface>
</Grid>
</UserControl>
BandSeriesChartExampleView.xaml.cs
View source code// *************************************************************************************
// SCICHART® Copyright SciChart Ltd. 2011-2022. All rights reserved.
//
// Web: http://www.scichart.com
// Support: support@scichart.com
// Sales: sales@scichart.com
//
// BandSeriesChartExampleView.xaml.cs is part of the SCICHART® Examples. Permission is hereby granted
// to modify, create derivative works, distribute and publish any part of this source
// code whether for commercial, private or personal use.
//
// The SCICHART® examples are distributed in the hope that they will be useful, but
// without any warranty. It is provided "AS IS" without warranty of any kind, either
// expressed or implied.
// *************************************************************************************
using System;
using System.Windows;
using System.Windows.Controls;
using System.Windows.Media.Animation;
using SciChart.Charting.Model.DataSeries;
using SciChart.Charting.Visuals.RenderableSeries;
using SciChart.Charting.Visuals.RenderableSeries.Animations;
using SciChart.Core.Extensions;
using SciChart.Examples.ExternalDependencies.Data;
namespace SciChart.Examples.Examples.CreateSimpleChart
{
/// <summary>
/// Interaction logic for BandSeriesChartExampleView.xaml
/// </summary>
public partial class BandSeriesChartExampleView : UserControl
{
public BandSeriesChartExampleView()
{
InitializeComponent();
}
private void BandSeriesChartExampleView_OnLoaded(object sender, RoutedEventArgs e)
{
// Set a DataSeries of type x=DateTime, y0=Double, y1=double on the RenderableSeries declared in XAML
var series = new XyyDataSeries<double, double>();
sciChart.RenderableSeries[0].DataSeries = series;
// Get some data for the upper and lower band
var data = DataManager.Instance.GetDampedSinewave(1.0, 0.01, 1000);
var moreData = DataManager.Instance.GetDampedSinewave(1.0, 0.005, 1000, 12);
// Append data to series. SciChart automatically redraws
series.Append(
data.XData,
data.YData,
moreData.YData);
}
}
}
