
The Band Series Type
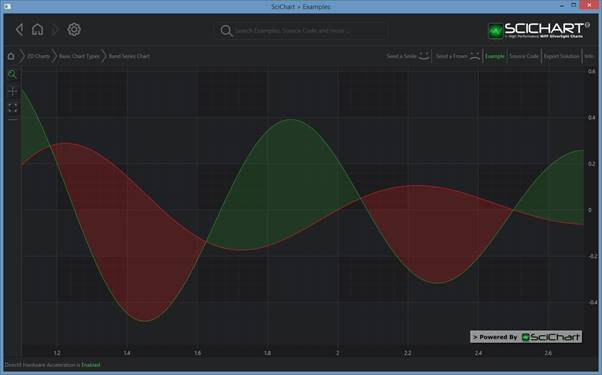
High-Low Fill or Band Series are provided by the FastBandRenderableSeries type. This accepts data from a XyyDataSeries (X,Y1, Y2) and renders two lines with a polygon, which changes color depending on whether Y1>Y2 or vice versa.
Examples for the Band Series can be found in the SciChart WPF Examples Suite which can be downloaded from the SciChart Website or our SciChart.WPF.Examples Github Repository.
NOTE: For info about XyyDataSeries, as well as other DataSeries types in SciChart, see DataSeries API
To declare a FastBandRenderableSeries, use the following code:
Declare a FastBandRenderableSeries in Xaml / Code Behind
| Declare a FastBandRenderableSeries |
Copy Code |
|---|---|
<!-- where xmlns:s="http://schemas.abtsoftware.co.uk/scichart" --> <s:SciChartSurface> <s:SciChartSurface.RenderableSeries> <s:FastBandRenderableSeries x:Name="rSeries" Stroke="GreenYellow" StrokeY1="Red" Fill="#33ADFF2F" FillY1="#33FF0000" StrokeThickness="1" AntiAliasing="True"/> </s:SciChartSurface.RenderableSeries> <!-- XAxis, YAxis omitted for brevity --> </s:SciChartSurface> // Code Behind, e.g. in OnLoaded event handler, set the DataSeries var xyyDataSeries = new XyyDataSeries<double, double>(); // FastBandRenderableSeries expects data in the format X,Y1, Y2 for (int i = 0; i < 100; i++) { double y = Math.Sin(i*0.2); double y1 = 0.5* Math.Sin(i*0.05); xyyDataSeries.Append(i,y, y1); } rSeries.DataSeries = hlcDataSeries; | |
Declare a FastBandRenderableSeries in Pure Code
| Declare a FastBandRenderableSeries |
Copy Code |
|---|---|
// Declare the scichartsurface var sciChartSurface = new SciChartSurface(); // ... // Declare and add a Error Bars Series var bandSeries = new FastBandRenderableSeries() { Stroke = Colors.GreenYellow, StrokeY1 = Colors.Red, Fill = Colors.FromArgb(0x33, 0xAD, 0xFF, 0x2D), FillY1 = Colors.FromArgb(0x33, 0xFF, 0x00, 0x00), AntiAliasing = true, StrokeThickness = 1, }; // Set some data // FastBandRenderableSeries expects data in the format X,Y1, Y2 var xyyDataSeries = new XyyDataSeries<double, double>(); for (int i = 0; i < 100; i++) { double y = Math.Sin(i*0.2); double y1 = 0.5* Math.Sin(i*0.05); xyyDataSeries.Append(i,y, y1); } errorBarsSeries.DataSeries = xyyDataSeries; | |
NOTE: You can also declare RenderableSeries using full MVVM (series ViewModels). Please see MVVM DataSeries / RenderableSeries API for more details.