WPF Chart - Examples
SciChart WPF ships with hundreds of WPF Chart Examples which you can browse, play with, view the source-code and even export each WPF Chart Example to a stand-alone Visual Studio solution. All of this is possible with the new and improved SciChart WPF Examples Suite, which ships as part of the SciChart WPF SDK.
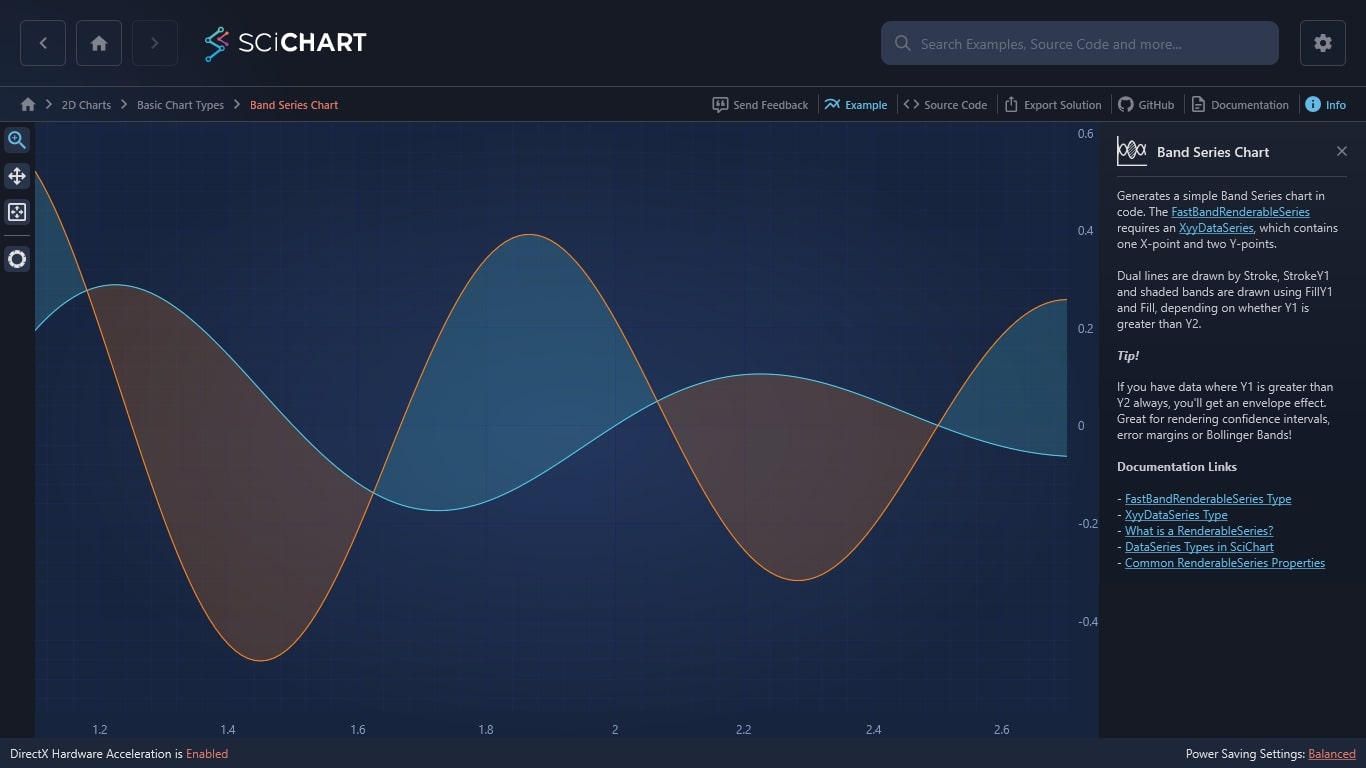
This WPF chart generates a simple Band Series chart in code. The FastBandRenderableSeries requires an XyyDataSeries, which contains one X-point and two Y-points.
Dual lines are drawn by Stroke, StrokeY1 and shaded bands are drawn using FillY1 and Fill, depending on whether Y1 is greater than Y2.
Tip!
If you have data where Y1 is greater than Y2 always, you’ll get an envelope effect. Great for rendering confidence intervals, error margins or Bollinger Bands!
Documentation Links

The C#/WPF source code for the WPF Band Series Chart example is included below (Scroll down!).
Did you know you can also view the source code from one of the following sources as well?
- Clone the SciChart.WPF.Examples from Github.
- Or, view source in the SciChart WPF Examples suite.
- Also the SciChart WPF Trial contains the full source for the examples (link below).
