WPF Chart - Examples
SciChart WPF ships with hundreds of WPF Chart Examples which you can browse, play with, view the source-code and even export each WPF Chart Example to a stand-alone Visual Studio solution. All of this is possible with the new and improved SciChart WPF Examples Suite, which ships as part of the SciChart WPF SDK.
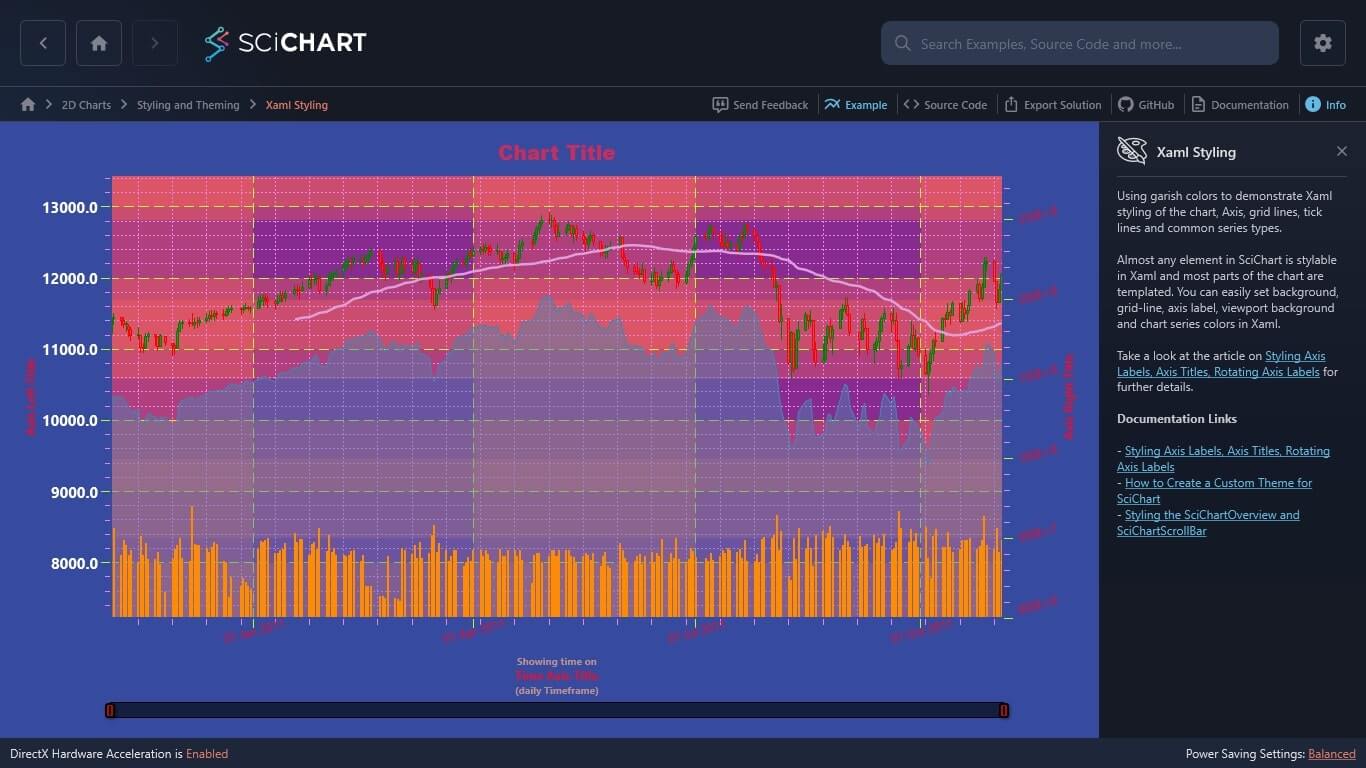
Using garish colors to demonstrate Xaml styling of the chart, Axis, grid lines, tick lines and common series types.
Almost any element in SciChart is stylable in Xaml and most parts of the chart are templated. You can easily set background, grid-line, axis label, viewport background and chart series colors in Xaml.
Take a look at the article on Styling Axis Labels, Axis Titles, Rotating Axis Labels for further details.
Documentation Links
– Styling Axis Labels, Axis Titles, Rotating Axis Labels
– How to Create a Custom Theme for SciChart
– Styling the SciChartOverview and SciChartScrollBar

The C#/WPF source code for the Styling a WPF Chart in XAML example is included below (Scroll down!).
Did you know you can also view the source code from one of the following sources as well?
- Clone the SciChart.WPF.Examples from Github.
- Or, view source in the SciChart WPF Examples suite.
- Also the SciChart WPF Trial contains the full source for the examples (link below).
XamlStyling.xaml
View source code<UserControl x:Class="SciChart.Examples.Examples.StyleAChart.XamlStyling"
xmlns="http://schemas.microsoft.com/winfx/2006/xaml/presentation"
xmlns:x="http://schemas.microsoft.com/winfx/2006/xaml"
xmlns:s="http://schemas.abtsoftware.co.uk/scichart"
xmlns:d="http://schemas.microsoft.com/expression/blend/2008"
xmlns:mc="http://schemas.openxmlformats.org/markup-compatibility/2006"
d:DesignHeight="400"
d:DesignWidth="600"
mc:Ignorable="d">
<UserControl.Resources>
<!-- Define styles for the SciChartSurface -->
<Style x:Key="SciChartSurfaceStyle" TargetType="s:SciChartSurface">
<Setter Property="Background" Value="Orange" />
<Setter Property="Padding" Value="20" />
<Setter Property="Foreground" Value="DarkOrchid" />
<Setter Property="FontSize" Value="20" />
<Setter Property="FontFamily" Value="Arial Black" />
<Setter Property="FontWeight" Value="Bold" />
<!-- Displays a border on the inner SciChartSurface -->
<Setter Property="BorderThickness" Value="2" />
<Setter Property="BorderBrush" Value="SteelBlue" />
</Style>
<!-- Define styles for the GridLinesPanel -->
<Style x:Key="GridLinesPanelStyle" TargetType="s:GridLinesPanel">
<Setter Property="Background" Value="Pink" />
<!-- NOTE: Do not set BorderThickness, BorderBrush here. Instead set it on SciChartSurface to get an inner chart border -->
</Style>
<Style x:Key="LeftAxisLabelStyle" TargetType="s:DefaultTickLabel">
<Setter Property="Foreground" Value="Green" />
<Setter Property="FontSize" Value="15" />
<Setter Property="FontWeight" Value="Bold" />
<!-- Align labels to the left side -->
<Setter Property="HorizontalAnchorPoint" Value="Right" />
</Style>
<!-- Using the LayoutTransform is much more apropriate in this point -->
<!-- the RenderTransform is used for demonstration purposes only, -->
<!-- for the compatibility with Silverlight reasons -->
<Style x:Key="AxisLabelStyle" TargetType="s:DefaultTickLabel">
<Setter Property="RenderTransform">
<Setter.Value>
<RotateTransform Angle="-15" />
</Setter.Value>
</Setter>
</Style>
<!-- Define styles for the X and Y Axes -->
<Style x:Key="AxisStyle" TargetType="s:AxisBase">
<Setter Property="FontSize" Value="12" />
<Setter Property="FontWeight" Value="Normal" />
<Setter Property="FontFamily" Value="Segoe UI" />
<Setter Property="TitleFontSize" Value="12" />
<Setter Property="TitleFontWeight" Value="Bold" />
<Setter Property="TickTextBrush" Value="Crimson" />
<Setter Property="DrawMajorBands" Value="True" />
<Setter Property="AxisBandsFill" Value="#55ff6655" />
<Setter Property="TickLabelStyle" Value="{StaticResource AxisLabelStyle}" />
<Setter Property="MajorTickLineStyle">
<Setter.Value>
<Style TargetType="Line">
<Setter Property="Stroke" Value="GreenYellow" />
<Setter Property="StrokeThickness" Value="1" />
<Setter Property="X2" Value="8" />
<Setter Property="Y2" Value="8" />
</Style>
</Setter.Value>
</Setter>
<Setter Property="MinorTickLineStyle">
<Setter.Value>
<Style TargetType="Line">
<Setter Property="Stroke" Value="Violet" />
<Setter Property="StrokeThickness" Value="1" />
<Setter Property="X2" Value="4" />
<Setter Property="Y2" Value="4" />
</Style>
</Setter.Value>
</Setter>
<Setter Property="MajorGridLineStyle">
<Setter.Value>
<Style TargetType="Line">
<Setter Property="Stroke" Value="GreenYellow" />
<Setter Property="StrokeThickness" Value="1" />
<Setter Property="StrokeDashArray" Value="10 5" />
</Style>
</Setter.Value>
</Setter>
<Setter Property="MinorGridLineStyle">
<Setter.Value>
<Style TargetType="Line">
<Setter Property="Stroke" Value="Violet" />
<Setter Property="StrokeThickness" Value="1" />
<Setter Property="StrokeDashArray" Value="2 2" />
</Style>
</Setter.Value>
</Setter>
</Style>
<Style x:Key="TitleTextStyle" TargetType="TextBlock">
<Setter Property="FontSize" Value="10" />
<Setter Property="HorizontalAlignment" Value="Center" />
<Setter Property="VerticalAlignment" Value="Center" />
<Setter Property="Foreground" Value="RosyBrown" />
</Style>
<Style x:Key="BottomAxisTitleStyle" TargetType="s:AxisTitle">
<Setter Property="ContentTemplate">
<Setter.Value>
<DataTemplate>
<StackPanel>
<TextBlock Margin="0,3,0,0"
Style="{StaticResource TitleTextStyle}"
Text="Showing time on" />
<TextBlock HorizontalAlignment="Center"
VerticalAlignment="Center"
Text="{Binding}" />
<TextBlock Margin="0,0,0,3"
Style="{StaticResource TitleTextStyle}"
Text="(daily Timeframe)" />
</StackPanel>
</DataTemplate>
</Setter.Value>
</Setter>
</Style>
<!-- Define style for the SciChartScrollbar -->
<Style x:Key="ScrollbarStyle" TargetType="s:SciChartScrollbar">
<Setter Property="GripsThickness" Value="10" />
<Setter Property="Background" Value="Transparent"/>
<!-- Define style for resizing grips -->
<Setter Property="GripsStyle">
<Setter.Value>
<Style TargetType="Control">
<Setter Property="VerticalAlignment" Value="Bottom" />
<Setter Property="Template">
<Setter.Value>
<ControlTemplate TargetType="Control">
<Border Height="15"
Background="#A90F0F"
BorderBrush="Black"
BorderThickness="2,2,2,2"
CornerRadius="2">
<Line Stretch="Fill"
Stroke="Black"
StrokeThickness="2"
X1="0"
X2="0"
Y1="0"
Y2="1" />
</Border>
</ControlTemplate>
</Setter.Value>
</Setter>
</Style>
</Setter.Value>
</Setter>
<!-- Define style for viewport area -->
<Setter Property="ViewportStyle">
<Setter.Value>
<Style TargetType="Control">
<Setter Property="Template">
<Setter.Value>
<ControlTemplate TargetType="Control">
<Border Background="#99000000"
BorderBrush="Black"
BorderThickness="0,1,0,1" />
</ControlTemplate>
</Setter.Value>
</Setter>
</Style>
</Setter.Value>
</Setter>
<!-- Define style for non selected area -->
<Setter Property="NonSelectedAreaStyle">
<Setter.Value>
<Style TargetType="Path">
<Setter Property="Fill" Value="#33000000" />
</Style>
</Setter.Value>
</Setter>
</Style>
</UserControl.Resources>
<!-- Declare a SciChartSurface and apply styles -->
<s:SciChartSurface x:Name="sciChart"
ChartTitle="Chart Title"
GridLinesPanelStyle="{StaticResource GridLinesPanelStyle}"
Style="{StaticResource SciChartSurfaceStyle}">
<s:SciChartSurface.RenderableSeries>
<s:FastMountainRenderableSeries x:Name="mountainSeries"
Fill="#774682B4"
Stroke="SteelBlue"
YAxisId="PrimaryAxisId">
<s:FastMountainRenderableSeries.SeriesAnimation>
<s:ScaleAnimation AnimationDelay="0:0:1" Duration="0:0:3"/>
</s:FastMountainRenderableSeries.SeriesAnimation>
</s:FastMountainRenderableSeries>
<s:FastCandlestickRenderableSeries x:Name="candlestickSeries"
FillDown="#88FF3333"
StrokeDown="Red"
FillUp="#88008800"
StrokeUp="Green"
YAxisId="PrimaryAxisId">
<s:FastCandlestickRenderableSeries.SeriesAnimation>
<s:SweepAnimation AnimationDelay="0:0:1" Duration="0:0:3"/>
</s:FastCandlestickRenderableSeries.SeriesAnimation>
</s:FastCandlestickRenderableSeries>
<s:FastLineRenderableSeries x:Name="lineSeries"
Stroke="Plum"
StrokeThickness="3"
YAxisId="PrimaryAxisId">
<s:FastLineRenderableSeries.SeriesAnimation>
<s:SweepAnimation AnimationDelay="0:0:1" Duration="0:0:3"/>
</s:FastLineRenderableSeries.SeriesAnimation>
</s:FastLineRenderableSeries>
<s:FastColumnRenderableSeries x:Name="columnSeries"
Fill="#AA4400"
Stroke="DarkOrange"
YAxisId="SecondaryAxisId">
<s:FastColumnRenderableSeries.SeriesAnimation>
<s:WaveAnimation AnimationDelay="0:0:1" Duration="0:0:3" PointDurationFraction="0.3"/>
</s:FastColumnRenderableSeries.SeriesAnimation>
</s:FastColumnRenderableSeries>
</s:SciChartSurface.RenderableSeries>
<s:SciChartSurface.XAxis>
<s:DateTimeAxis AxisTitle="Time Axis Title"
Style="{StaticResource AxisStyle}"
TitleStyle="{StaticResource BottomAxisTitleStyle}">
<s:DateTimeAxis.Scrollbar>
<s:SciChartScrollbar Style="{StaticResource ScrollbarStyle}" />
</s:DateTimeAxis.Scrollbar>
</s:DateTimeAxis>
</s:SciChartSurface.XAxis>
<s:SciChartSurface.YAxes>
<s:NumericAxis AxisAlignment="Left"
AxisTitle="Axis Left Title"
Id="PrimaryAxisId"
Style="{StaticResource AxisStyle}"
TextFormatting="#.0"
TickLabelStyle="{StaticResource LeftAxisLabelStyle}">
<s:NumericAxis.Resources>
<!-- Example of styling axis labels -->
<Style TargetType="TextBlock">
<Setter Property="Margin" Value="0,0,0,0" />
<Setter Property="FontFamily" Value="Arial" />
<Setter Property="FontWeight" Value="Bold" />
<Setter Property="FontSize" Value="20" />
</Style>
</s:NumericAxis.Resources>
<s:NumericAxis.GrowBy>
<s:DoubleRange Max="0.15" Min="0.6" />
</s:NumericAxis.GrowBy>
</s:NumericAxis>
<s:NumericAxis AxisAlignment="Right"
AxisTitle="Axis Right Title"
Id="SecondaryAxisId"
Style="{StaticResource AxisStyle}"
TextFormatting="###E+0">
<s:NumericAxis.GrowBy>
<s:DoubleRange Max="3.0" Min="0" />
</s:NumericAxis.GrowBy>
</s:NumericAxis>
</s:SciChartSurface.YAxes>
</s:SciChartSurface>
</UserControl>
XamlStyling.xaml.cs
View source code// *************************************************************************************
// SCICHART® Copyright SciChart Ltd. 2011-2022. All rights reserved.
//
// Web: http://www.scichart.com
// Support: support@scichart.com
// Sales: sales@scichart.com
//
// XamlStyling.xaml.cs is part of the SCICHART® Examples. Permission is hereby granted
// to modify, create derivative works, distribute and publish any part of this source
// code whether for commercial, private or personal use.
//
// The SCICHART® examples are distributed in the hope that they will be useful, but
// without any warranty. It is provided "AS IS" without warranty of any kind, either
// expressed or implied.
// *************************************************************************************
using System;
using System.Linq;
using System.Windows;
using System.Windows.Controls;
using SciChart.Charting.Model.DataSeries;
using SciChart.Examples.ExternalDependencies.Common;
using SciChart.Examples.ExternalDependencies.Data;
namespace SciChart.Examples.Examples.StyleAChart
{
public partial class XamlStyling : UserControl
{
public XamlStyling()
{
InitializeComponent();
Loaded += OnLoaded;
}
private void OnLoaded(object sender, RoutedEventArgs routedEventArgs)
{
using (sciChart.SuspendUpdates())
{
// Create some DataSeries of type x=DateTime, y=Double
var dataSeries0 = new XyDataSeries<DateTime, double>();
var dataSeries1 = new OhlcDataSeries<DateTime, double>();
var dataSeries2 = new XyDataSeries<DateTime, double>();
var dataSeries3 = new XyDataSeries<DateTime, double>();
var dataSource = DataManager.Instance;
// Prices are in the format Time, Open, High, Low, Close (all IList)
var prices = dataSource.GetPriceData(Instrument.Indu.Value, TimeFrame.Daily);
// Append data to series.
dataSeries0.Append(prices.TimeData, dataSource.Offset(prices.LowData, -1000));
dataSeries1.Append(prices.TimeData, prices.OpenData, prices.HighData, prices.LowData, prices.CloseData);
dataSeries2.Append(prices.TimeData, dataSource.ComputeMovingAverage(prices.CloseData, 50));
dataSeries3.Append(prices.TimeData, prices.VolumeData.Select(x => (double)x));
// Assign data to RenderableSeries
mountainSeries.DataSeries = dataSeries0;
candlestickSeries.DataSeries = dataSeries1;
lineSeries.DataSeries = dataSeries2;
columnSeries.DataSeries = dataSeries3;
sciChart.ZoomExtents();
}
}
}
}
