WPF Chart - Examples
SciChart WPF ships with hundreds of WPF Chart Examples which you can browse, play with, view the source-code and even export each WPF Chart Example to a stand-alone Visual Studio solution. All of this is possible with the new and improved SciChart WPF Examples Suite, which ships as part of the SciChart WPF SDK.
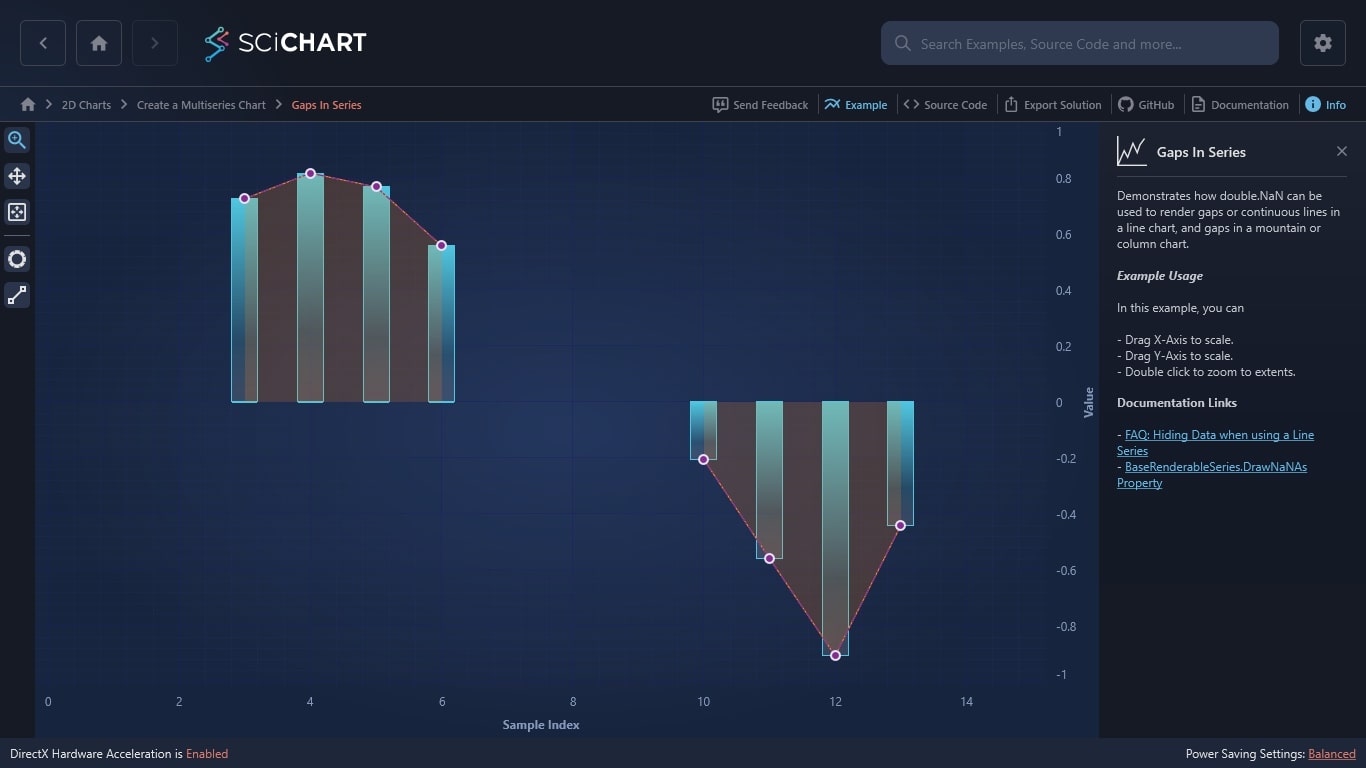
Demonstrates how double.NaN can be used to render gaps or continuous lines in a line chart, and gaps in a mountain or column chart.
Example Usage
In this example, you can
– Drag X-Axis to scale.
– Drag Y-Axis to scale.
– Double click to zoom to extents.
Documentation Links
– FAQ: Hiding Data when using a Line Series
– BaseRenderableSeries.DrawNaNAs Property

The C#/WPF source code for the WPF Chart Gaps (Nulls) in Series example is included below (Scroll down!).
Did you know you can also view the source code from one of the following sources as well?
- Clone the SciChart.WPF.Examples from Github.
- Or, view source in the SciChart WPF Examples suite.
- Also the SciChart WPF Trial contains the full source for the examples (link below).
GapsInSeries.xaml
View source code<UserControl x:Class="SciChart.Examples.Examples.CreateMultiseriesChart.GapsInSeries"
xmlns="http://schemas.microsoft.com/winfx/2006/xaml/presentation"
xmlns:x="http://schemas.microsoft.com/winfx/2006/xaml"
xmlns:s="http://schemas.abtsoftware.co.uk/scichart"
xmlns:mc="http://schemas.openxmlformats.org/markup-compatibility/2006"
xmlns:d="http://schemas.microsoft.com/expression/blend/2008"
xmlns:ext="http://schemas.abtsoftware.co.uk/scichart/exampleExternals"
d:DesignHeight="400"
d:DesignWidth="600"
mc:Ignorable="d">
<Grid>
<Grid.ColumnDefinitions>
<ColumnDefinition Width="Auto" />
<ColumnDefinition Width="*" />
</Grid.ColumnDefinitions>
<!-- The SciChartInteractionToolbar adds zoom, pan, zoom extents and rotate functionality -->
<!-- to the chart and is included for example purposes. -->
<!-- If you wish to know how to zoom and pan a chart then do a search for Zoom Pan in the Examples suite! -->
<ext:SciChartInteractionToolbar TargetSurface="{Binding Source={x:Reference Name=sciChart}}" >
<ext:FlyoutMenuButton Style="{StaticResource FlyoutMenuButtonStyle}" Content="GAP" Padding="0">
<ext:FlyoutMenuButton.PopupContent>
<StackPanel Orientation="Vertical" MinWidth="150" Margin="0,0,0,5">
<TextBlock Text="RenderableSeries.DrawNaNAs" />
<ext:FlyoutSeparator/>
<CheckBox x:Name="gapsCheckbox"
Content="Gaps"
Margin="4"
IsChecked="True"
Checked="GapsCheckbox_CheckedChanged"
Unchecked="GapsCheckbox_CheckedChanged"/>
<CheckBox x:Name="closedLinesCheckbox"
Content="Closed Lines"
Margin="4"
Checked="ClosedCheckbox_CheckedChanged"
Unchecked="ClosedCheckbox_CheckedChanged"/>
</StackPanel>
</ext:FlyoutMenuButton.PopupContent>
</ext:FlyoutMenuButton>
</ext:SciChartInteractionToolbar>
<s:SciChartSurface x:Name="sciChart"
Grid.Column="1"
Padding="0"
BorderThickness="0">
<s:SciChartSurface.RenderableSeries>
<!-- Column Series -->
<s:FastColumnRenderableSeries x:Name="renderableColumnSeries" Stroke="OrangeRed">
<s:FastColumnRenderableSeries.Fill>
<LinearGradientBrush StartPoint="0,0" EndPoint="0,1">
<GradientStop Offset="0" Color="#FFFF867B" />
<GradientStop Offset="0.7" Color="#88FFFF9B" />
<GradientStop Offset="1" Color="#22FFFFFF" />
</LinearGradientBrush>
</s:FastColumnRenderableSeries.Fill>
<s:FastColumnRenderableSeries.SeriesAnimation>
<s:FadeAnimation AnimationDelay="0:0:1" Duration="0:0:3"/>
</s:FastColumnRenderableSeries.SeriesAnimation>
</s:FastColumnRenderableSeries>
<!-- Mountain Series -->
<s:FastMountainRenderableSeries x:Name="renderableMountainSeries"
Fill="#33FFFF00"
Stroke="#FFFF00">
<s:FastMountainRenderableSeries.SeriesAnimation>
<s:FadeAnimation AnimationDelay="0:0:1" Duration="0:0:3"/>
</s:FastMountainRenderableSeries.SeriesAnimation>
</s:FastMountainRenderableSeries>
<!-- Line Series -->
<s:FastLineRenderableSeries x:Name="renderableLineSeries"
Stroke="OrangeRed"
StrokeDashArray="2,2,9,2">
<s:FastLineRenderableSeries.PointMarker>
<s:EllipsePointMarker Width="11"
Height="11"
Fill="Red"
Stroke="Lavender"
StrokeThickness="2" />
</s:FastLineRenderableSeries.PointMarker>
<s:FastLineRenderableSeries.SeriesAnimation>
<s:FadeAnimation AnimationDelay="0:0:1" Duration="0:0:3"/>
</s:FastLineRenderableSeries.SeriesAnimation>
</s:FastLineRenderableSeries>
</s:SciChartSurface.RenderableSeries>
<s:SciChartSurface.XAxis>
<s:NumericAxis AxisTitle="Sample Index" DrawMajorBands="True"/>
</s:SciChartSurface.XAxis>
<s:SciChartSurface.YAxis>
<s:NumericAxis AxisTitle="Value" DrawMajorBands="True"/>
</s:SciChartSurface.YAxis>
</s:SciChartSurface>
</Grid>
</UserControl>GapsInSeries.xaml.cs
View source code// *************************************************************************************
// SCICHART® Copyright SciChart Ltd. 2011-2022. All rights reserved.
//
// Web: http://www.scichart.com
// Support: support@scichart.com
// Sales: sales@scichart.com
//
// GapsInSeries.xaml.cs is part of the SCICHART® Examples. Permission is hereby granted
// to modify, create derivative works, distribute and publish any part of this source
// code whether for commercial, private or personal use.
//
// The SCICHART® examples are distributed in the hope that they will be useful, but
// without any warranty. It is provided "AS IS" without warranty of any kind, either
// expressed or implied.
// *************************************************************************************
using System;
using System.Windows;
using System.Windows.Controls;
using SciChart.Charting.Model.DataSeries;
using SciChart.Charting.Visuals.RenderableSeries;
using SciChart.Data.Model;
using SciChart.Examples.ExternalDependencies.Data;
namespace SciChart.Examples.Examples.CreateMultiseriesChart
{
/// <summary>
/// Interaction logic for GapsInSeries.xaml
/// </summary>
public partial class GapsInSeries : UserControl
{
// A drop in replacement for System.Random which is 3x faster: https://www.codeproject.com/Articles/9187/A-fast-equivalent-for-System-Random
//private readonly RandomWalkGenerator _random = new RandomWalkGenerator();
public GapsInSeries()
{
InitializeComponent();
Loaded += OnLoaded;
}
private void OnLoaded(object sender, RoutedEventArgs routedEventArgs)
{
var dataSeries = CreateDataSeries();
renderableColumnSeries.DataSeries = dataSeries;
renderableLineSeries.DataSeries = dataSeries;
renderableMountainSeries.DataSeries = dataSeries;
sciChart.ZoomExtents();
sciChart.YAxis.VisibleRange = new DoubleRange(-1, 1);
}
private IXyDataSeries<double, double> CreateDataSeries()
{
var _random = new RandomWalkGenerator(seed: 0);
var dataSeries = new XyDataSeries<double, double>();
dataSeries.SeriesName = "Random Series";
int i = 0;
// Samples 0,1,2 append double.NaN
for (; i < 3; i++)
{
dataSeries.Append(i, double.NaN);
}
// Samples 3,4,5,6 append values
for (; i < 7; i++)
{
dataSeries.Append(i, _random.GetRandomDouble());
}
// Samples 7,8,9 append double.NaN
for (; i < 10; i++)
{
dataSeries.Append(i, double.NaN);
}
// Samples 10,11,12,13 append values
for (; i < 14; i++)
{
dataSeries.Append(i, -_random.GetRandomDouble());
}
// Samples 14,15,16 append double.NaN
for (; i < 16; i++)
{
dataSeries.Append(i, double.NaN);
}
return dataSeries;
}
private void GapsCheckbox_CheckedChanged(object sender, RoutedEventArgs e)
{
if (gapsCheckbox != null && closedLinesCheckbox != null)
{
if (gapsCheckbox.IsChecked == true)
{
foreach (var rSeries in sciChart.RenderableSeries)
{
rSeries.DrawNaNAs = LineDrawMode.Gaps;
}
closedLinesCheckbox.IsChecked = false;
}
if (gapsCheckbox.IsChecked == false && closedLinesCheckbox.IsChecked == false)
{
gapsCheckbox.IsChecked = true;
}
}
}
private void ClosedCheckbox_CheckedChanged(object sender, RoutedEventArgs e)
{
if (closedLinesCheckbox != null && gapsCheckbox != null)
{
if (closedLinesCheckbox.IsChecked == true)
{
foreach (var rSeries in sciChart.RenderableSeries)
{
rSeries.DrawNaNAs = LineDrawMode.ClosedLines;
}
gapsCheckbox.IsChecked = false;
}
if (gapsCheckbox.IsChecked == false && closedLinesCheckbox.IsChecked == false)
{
closedLinesCheckbox.IsChecked = true;
}
}
}
}
}
