WPF Chart - Examples
SciChart WPF ships with hundreds of WPF Chart Examples which you can browse, play with, view the source-code and even export each WPF Chart Example to a stand-alone Visual Studio solution. All of this is possible with the new and improved SciChart WPF Examples Suite, which ships as part of the SciChart WPF SDK.
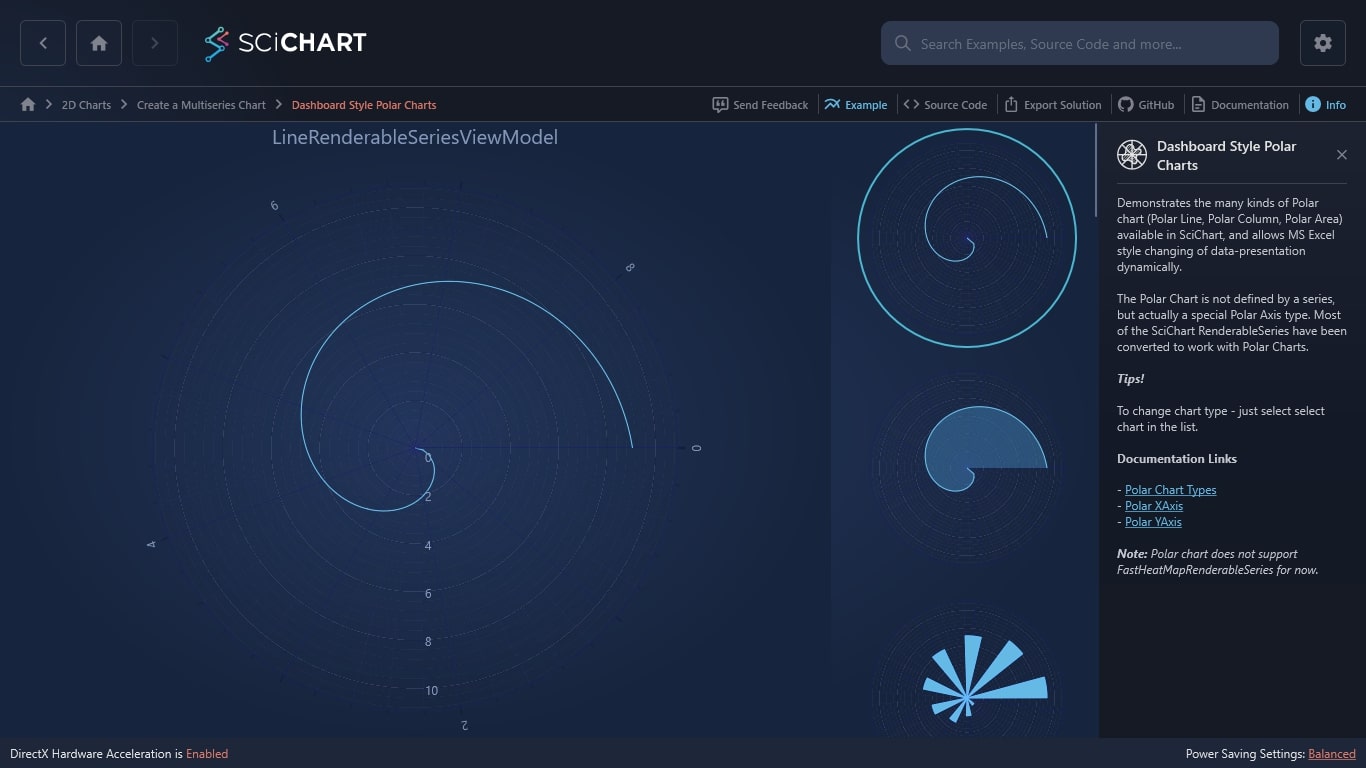
Demonstrates the many kinds of Polar chart (Polar Line, Polar Column, Polar Area) available in SciChart, and allows MS Excel style changing of data-presentation dynamically.
The Polar Chart is not defined by a series, but actually a special Polar Axis type. Most of the SciChart RenderableSeries have been converted to work with Polar Charts.
Tips!
To change chart type – just select select chart in the list.
Documentation Links
– Polar Chart Types
– Polar XAxis
– Polar YAxis
Note: Polar chart does not support FastHeatMapRenderableSeries for now.

The C#/WPF source code for the WPF Dashboard Style Polar Charts example is included below (Scroll down!).
Did you know you can also view the source code from one of the following sources as well?
- Clone the SciChart.WPF.Examples from Github.
- Or, view source in the SciChart WPF Examples suite.
- Also the SciChart WPF Trial contains the full source for the examples (link below).
DashboardStylePolarChartsView.xaml
View source code<UserControl x:Class="SciChart.Examples.Examples.CreateMultiseriesChart.DashboardStylePolarCharts.DashboardStylePolarChartsView"
xmlns="http://schemas.microsoft.com/winfx/2006/xaml/presentation"
xmlns:x="http://schemas.microsoft.com/winfx/2006/xaml"
xmlns:d="http://schemas.microsoft.com/expression/blend/2008"
xmlns:local="clr-namespace:SciChart.Examples.Examples.CreateMultiseriesChart.DashboardStylePolarCharts"
xmlns:mc="http://schemas.openxmlformats.org/markup-compatibility/2006"
xmlns:s="http://schemas.abtsoftware.co.uk/scichart"
d:DesignHeight="400"
d:DesignWidth="600"
mc:Ignorable="d">
<UserControl.Resources>
<Style x:Key="ListBoxStyle" TargetType="ListBox">
<Setter Property="Background" Value="Transparent" />
<Setter Property="BorderThickness" Value="0" />
<Setter Property="ItemsPanel">
<Setter.Value>
<ItemsPanelTemplate>
<StackPanel Orientation="Vertical" />
</ItemsPanelTemplate>
</Setter.Value>
</Setter>
<Setter Property="ItemContainerStyle">
<Setter.Value>
<Style TargetType="ListBoxItem">
<Setter Property="Padding" Value="3" />
<Setter Property="HorizontalContentAlignment" Value="Left" />
<Setter Property="VerticalContentAlignment" Value="Top" />
<Setter Property="Background" Value="Transparent" />
<Setter Property="BorderThickness" Value="1" />
<Setter Property="Template">
<Setter.Value>
<ControlTemplate TargetType="ListBoxItem">
<Grid Background="{TemplateBinding Background}">
<VisualStateManager.VisualStateGroups>
<VisualStateGroup x:Name="CommonStates">
<VisualState x:Name="Normal" />
<VisualState x:Name="MouseOver">
<Storyboard>
<DoubleAnimation Duration="0"
Storyboard.TargetName="fillColor"
Storyboard.TargetProperty="Opacity"
To=".35" />
</Storyboard>
</VisualState>
<VisualState x:Name="Disabled">
<Storyboard>
<DoubleAnimation Duration="0"
Storyboard.TargetName="contentPresenter"
Storyboard.TargetProperty="Opacity"
To=".55" />
</Storyboard>
</VisualState>
</VisualStateGroup>
<VisualStateGroup x:Name="SelectionStates">
<VisualState x:Name="Unselected" />
<VisualState x:Name="Selected">
<Storyboard>
<DoubleAnimation Duration="0"
Storyboard.TargetName="fillColor2"
Storyboard.TargetProperty="Opacity"
To=".75" />
</Storyboard>
</VisualState>
</VisualStateGroup>
<VisualStateGroup x:Name="FocusStates">
<VisualState x:Name="Focused">
<Storyboard>
<ObjectAnimationUsingKeyFrames Duration="0"
Storyboard.TargetName="FocusVisualElement"
Storyboard.TargetProperty="Visibility">
<DiscreteObjectKeyFrame KeyTime="0">
<DiscreteObjectKeyFrame.Value>
<Visibility>Visible</Visibility>
</DiscreteObjectKeyFrame.Value>
</DiscreteObjectKeyFrame>
</ObjectAnimationUsingKeyFrames>
</Storyboard>
</VisualState>
<VisualState x:Name="Unfocused" />
</VisualStateGroup>
</VisualStateManager.VisualStateGroups>
<Rectangle x:Name="fillColor"
Fill="#FF0FA32D"
IsHitTestVisible="False"
Opacity="0"
RadiusX="1"
RadiusY="1" />
<Rectangle x:Name="fillColor2"
Fill="#FF0FA32D"
IsHitTestVisible="False"
Opacity="0"
RadiusX="1"
RadiusY="1" />
<ContentPresenter x:Name="contentPresenter"
Margin="{TemplateBinding Padding}"
HorizontalAlignment="{TemplateBinding HorizontalContentAlignment}"
Content="{TemplateBinding Content}"
ContentTemplate="{TemplateBinding ContentTemplate}" />
<Rectangle x:Name="FocusVisualElement"
RadiusX="1"
RadiusY="1"
Stroke="#FF0FA32D"
StrokeThickness="1"
Visibility="Collapsed" />
</Grid>
</ControlTemplate>
</Setter.Value>
</Setter>
</Style>
</Setter.Value>
</Setter>
<Setter Property="ItemTemplate">
<Setter.Value>
<DataTemplate DataType="local:PolarChartViewModel">
<Grid Width="200" Height="200">
<local:PolarChartView HorizontalAlignment="Stretch" VerticalAlignment="Stretch" />
<Border HorizontalAlignment="Stretch" VerticalAlignment="Stretch">
<Border.Background>
<LinearGradientBrush StartPoint="0.5,0" EndPoint="1,0">
<GradientStop Offset="0.0" Color="#00FEFEFE" />
<GradientStop Offset="1.0" Color="#00000000" />
</LinearGradientBrush>
</Border.Background>
</Border>
</Grid>
</DataTemplate>
</Setter.Value>
</Setter>
</Style>
</UserControl.Resources>
<DockPanel>
<ListBox DockPanel.Dock="Right"
Margin="20,0,0,0"
ItemsSource="{Binding PolarChartViewModels}"
SelectedItem="{Binding CurrentViewModel, Mode=TwoWay}"
SelectionMode="Single"
Style="{StaticResource ListBoxStyle}" />
<s:SciChartSurface ChartTitle="{Binding CurrentViewModel.Title}"
RenderableSeries="{s:SeriesBinding CurrentViewModel.RenderableSeriesViewModel}"
ViewportManager="{Binding ViewportManager}">
<s:SciChartSurface.XAxis>
<s:PolarXAxis />
</s:SciChartSurface.XAxis>
<s:SciChartSurface.YAxis>
<s:PolarYAxis GrowBy="0.0,0.2" />
</s:SciChartSurface.YAxis>
<s:SciChartSurface.ChartModifier>
<s:ModifierGroup>
<s:MouseWheelZoomModifier />
<s:ZoomExtentsModifier />
</s:ModifierGroup>
</s:SciChartSurface.ChartModifier>
</s:SciChartSurface>
</DockPanel>
</UserControl>DashboardStylePolarChartsView.xaml.cs
View source code// *************************************************************************************
// SCICHART® Copyright SciChart Ltd. 2011-2022. All rights reserved.
//
// Web: http://www.scichart.com
// Support: support@scichart.com
// Sales: sales@scichart.com
//
// DashboardStylePolarChartsView.xaml.cs is part of the SCICHART® Examples. Permission is hereby granted
// to modify, create derivative works, distribute and publish any part of this source
// code whether for commercial, private or personal use.
//
// The SCICHART® examples are distributed in the hope that they will be useful, but
// without any warranty. It is provided "AS IS" without warranty of any kind, either
// expressed or implied.
// *************************************************************************************
using System.Windows.Controls;
namespace SciChart.Examples.Examples.CreateMultiseriesChart.DashboardStylePolarCharts
{
/// <summary>
/// Interaction logic for DashboardStylePolarChartsView.xaml
/// </summary>
public partial class DashboardStylePolarChartsView : UserControl
{
public DashboardStylePolarChartsView()
{
InitializeComponent();
}
}
}
DashboardStylePolarChartsViewModel.cs
View source code// *************************************************************************************
// SCICHART® Copyright SciChart Ltd. 2011-2022. All rights reserved.
//
// Web: http://www.scichart.com
// Support: support@scichart.com
// Sales: sales@scichart.com
//
// DashboardStylePolarChartsViewModel.cs is part of the SCICHART® Examples. Permission is hereby granted
// to modify, create derivative works, distribute and publish any part of this source
// code whether for commercial, private or personal use.
//
// The SCICHART® examples are distributed in the hope that they will be useful, but
// without any warranty. It is provided "AS IS" without warranty of any kind, either
// expressed or implied.
// *************************************************************************************
using System;
using System.Collections.ObjectModel;
using System.Linq;
using System.Windows.Threading;
using SciChart.Charting.Model.ChartSeries;
using SciChart.Charting.ViewportManagers;
using SciChart.Examples.ExternalDependencies.Common;
namespace SciChart.Examples.Examples.CreateMultiseriesChart.DashboardStylePolarCharts
{
public class DashboardStylePolarChartsViewModel : BaseViewModel
{
private PolarChartViewModel _currentViewModel;
public ObservableCollection<PolarChartViewModel> PolarChartViewModels { get; set; }
public IViewportManager ViewportManager { get; } = new DefaultViewportManager();
public PolarChartViewModel CurrentViewModel
{
get => _currentViewModel;
set
{
if (_currentViewModel != value)
{
_currentViewModel = value;
OnPropertyChanged(nameof(CurrentViewModel));
// Defer ZoomExtents execution setting DispatcherPriority lower then DispatcherPriority.Binding.
// This is required to perform ZoomExtents after DataSeries binding is applied.
Dispatcher.CurrentDispatcher.BeginInvoke(new Action(
() => ViewportManager.AnimateZoomExtents(TimeSpan.FromMilliseconds(500))),
DispatcherPriority.Background);
}
}
}
public DashboardStylePolarChartsViewModel()
{
PolarChartViewModels = new ObservableCollection<PolarChartViewModel>
{
PolarChartViewModelFactory.New<LineRenderableSeriesViewModel>(),
PolarChartViewModelFactory.New<MountainRenderableSeriesViewModel>(),
PolarChartViewModelFactory.New<ColumnRenderableSeriesViewModel>(),
PolarChartViewModelFactory.New<XyScatterRenderableSeriesViewModel>(),
PolarChartViewModelFactory.New<ImpulseRenderableSeriesViewModel>(),
PolarChartViewModelFactory.New<CandlestickRenderableSeriesViewModel>(),
PolarChartViewModelFactory.New<OhlcRenderableSeriesViewModel>(),
PolarChartViewModelFactory.New<ErrorBarsRenderableSeriesViewModel>(),
PolarChartViewModelFactory.New<BoxPlotRenderableSeriesViewModel>(),
PolarChartViewModelFactory.New<BandRenderableSeriesViewModel>(),
PolarChartViewModelFactory.New<BubbleRenderableSeriesViewModel>(),
PolarChartViewModelFactory.New<StackedMountainRenderableSeriesViewModel>(),
PolarChartViewModelFactory.New<StackedColumnRenderableSeriesViewModel>()
};
_currentViewModel = PolarChartViewModels.FirstOrDefault();
}
}
}PolarChartView.xaml
View source code<UserControl x:Class="SciChart.Examples.Examples.CreateMultiseriesChart.DashboardStylePolarCharts.PolarChartView"
xmlns="http://schemas.microsoft.com/winfx/2006/xaml/presentation"
xmlns:x="http://schemas.microsoft.com/winfx/2006/xaml"
xmlns:d="http://schemas.microsoft.com/expression/blend/2008"
xmlns:mc="http://schemas.openxmlformats.org/markup-compatibility/2006"
xmlns:s="http://schemas.abtsoftware.co.uk/scichart"
d:DesignHeight="400"
d:DesignWidth="600"
mc:Ignorable="d">
<Grid>
<!-- Create the chart surface -->
<s:SciChartSurface Padding="0" RenderableSeries="{s:SeriesBinding RenderableSeriesViewModel}">
<s:SciChartSurface.XAxis>
<s:PolarXAxis AutoRange="Always"
DrawLabels="False"
DrawMajorTicks="False"
DrawMinorTicks="False" />
</s:SciChartSurface.XAxis>
<s:SciChartSurface.YAxis>
<s:PolarYAxis AutoRange="Always"
DrawLabels="False"
DrawMajorTicks="False"
DrawMinorTicks="False"
GrowBy="0.0,0.2" />
</s:SciChartSurface.YAxis>
</s:SciChartSurface>
</Grid>
</UserControl>
PolarChartView.xaml.cs
View source code// *************************************************************************************
// SCICHART® Copyright SciChart Ltd. 2011-2022. All rights reserved.
//
// Web: http://www.scichart.com
// Support: support@scichart.com
// Sales: sales@scichart.com
//
// PolarChartView.xaml.cs is part of the SCICHART® Examples. Permission is hereby granted
// to modify, create derivative works, distribute and publish any part of this source
// code whether for commercial, private or personal use.
//
// The SCICHART® examples are distributed in the hope that they will be useful, but
// without any warranty. It is provided "AS IS" without warranty of any kind, either
// expressed or implied.
// *************************************************************************************
using System.Windows.Controls;
namespace SciChart.Examples.Examples.CreateMultiseriesChart.DashboardStylePolarCharts
{
/// <summary>
/// Interaction logic for PolarChartView.xaml
/// </summary>
public partial class PolarChartView : UserControl
{
public PolarChartView()
{
InitializeComponent();
}
}
}
PolarChartViewModel.cs
View source code// *************************************************************************************
// SCICHART® Copyright SciChart Ltd. 2011-2022. All rights reserved.
//
// Web: http://www.scichart.com
// Support: support@scichart.com
// Sales: sales@scichart.com
//
// PolarChartViewModel.cs is part of the SCICHART® Examples. Permission is hereby granted
// to modify, create derivative works, distribute and publish any part of this source
// code whether for commercial, private or personal use.
//
// The SCICHART® examples are distributed in the hope that they will be useful, but
// without any warranty. It is provided "AS IS" without warranty of any kind, either
// expressed or implied.
// *************************************************************************************
using System.Collections.Generic;
using System.Linq;
using SciChart.Charting.Model.ChartSeries;
using SciChart.Examples.ExternalDependencies.Common;
namespace SciChart.Examples.Examples.CreateMultiseriesChart.DashboardStylePolarCharts
{
public class PolarChartViewModel : BaseViewModel
{
public List<IRenderableSeriesViewModel> RenderableSeriesViewModel { get; private set; }
public string Title { get; private set; }
public PolarChartViewModel(params IRenderableSeriesViewModel[] series)
{
RenderableSeriesViewModel = new List<IRenderableSeriesViewModel>(series);
Title = series.First().GetType().Name;
}
}
}PolarChartViewModelFactory.cs
View source code// *************************************************************************************
// SCICHART® Copyright SciChart Ltd. 2011-2022. All rights reserved.
//
// Web: http://www.scichart.com
// Support: support@scichart.com
// Sales: sales@scichart.com
//
// PolarChartViewModelFactory.cs is part of the SCICHART® Examples. Permission is hereby granted
// to modify, create derivative works, distribute and publish any part of this source
// code whether for commercial, private or personal use.
//
// The SCICHART® examples are distributed in the hope that they will be useful, but
// without any warranty. It is provided "AS IS" without warranty of any kind, either
// expressed or implied.
// *************************************************************************************
using System;
using System.Collections.Generic;
using System.Linq;
using System.Windows.Media;
using SciChart.Charting.Model.ChartSeries;
using SciChart.Charting.Model.DataSeries;
using SciChart.Charting.Visuals.PointMarkers;
namespace SciChart.Examples.Examples.CreateMultiseriesChart.DashboardStylePolarCharts
{
public static class PolarChartViewModelFactory
{
private const int PointAmount = 10;
public static PolarChartViewModel New<T>() where T : IRenderableSeriesViewModel
{
var type = typeof(T);
var data = Enumerable.Range(0, PointAmount).Select(x => (double) x).ToList();
if (type == typeof(LineRenderableSeriesViewModel))
{
return new PolarChartViewModel(new LineRenderableSeriesViewModel {DataSeries = GetXyDataSeries(data)});
}
if (type == typeof(XyScatterRenderableSeriesViewModel))
{
return new PolarChartViewModel(new XyScatterRenderableSeriesViewModel
{
DataSeries = GetXyDataSeries(data),
PointMarker = new EllipsePointMarker
{
Width = 10,
Height = 10,
Fill = Color.FromArgb(255, 71, 187, 255),
Stroke = Colors.Black
}
});
}
if (type == typeof(MountainRenderableSeriesViewModel))
{
return new PolarChartViewModel(new MountainRenderableSeriesViewModel
{DataSeries = GetXyDataSeries(data)});
}
if (type == typeof(ColumnRenderableSeriesViewModel))
{
return new PolarChartViewModel(new ColumnRenderableSeriesViewModel
{DataSeries = GetXyDataSeries(data)});
}
if (type == typeof(ImpulseRenderableSeriesViewModel))
{
return new PolarChartViewModel(new ImpulseRenderableSeriesViewModel
{DataSeries = GetHlcDataSeries(data)});
}
if (type == typeof(CandlestickRenderableSeriesViewModel))
{
return new PolarChartViewModel(new CandlestickRenderableSeriesViewModel
{DataSeries = GetOhlcDataSeries(data)});
}
if (type == typeof(OhlcRenderableSeriesViewModel))
{
return new PolarChartViewModel(new OhlcRenderableSeriesViewModel
{DataSeries = GetOhlcDataSeries(data)});
}
if (type == typeof(BoxPlotRenderableSeriesViewModel))
{
return new PolarChartViewModel(new BoxPlotRenderableSeriesViewModel {DataSeries = GetBoxSeries(data)});
}
if (type == typeof(ErrorBarsRenderableSeriesViewModel))
{
return new PolarChartViewModel(new ErrorBarsRenderableSeriesViewModel
{DataSeries = GetHlcDataSeries(data)});
}
if (type == typeof(BubbleRenderableSeriesViewModel))
{
return new PolarChartViewModel(new BubbleRenderableSeriesViewModel
{
DataSeries = GetXyzDataSeries(data),
BubbleColor = Color.FromArgb(255, 110, 0, 255),
AutoZRange = false,
});
}
if (type == typeof(BandRenderableSeriesViewModel))
{
return new PolarChartViewModel(new BandRenderableSeriesViewModel {DataSeries = GetXyyDataSeries(data)});
}
if (type == typeof(StackedColumnRenderableSeriesViewModel))
{
return new PolarChartViewModel(
new StackedColumnRenderableSeriesViewModel
{
DataSeries = GetXyDataSeries(data),
Fill = new SolidColorBrush(Color.FromArgb(255, 0, 2, 195)),
StackedGroupId = "stackedColumns"
},
new StackedColumnRenderableSeriesViewModel
{
DataSeries = GetXyDataSeries(data),
Fill = new SolidColorBrush(Color.FromArgb(255, 0, 143, 255)),
StackedGroupId = "stackedColumns"
},
new StackedColumnRenderableSeriesViewModel
{
DataSeries = GetXyDataSeries(data),
Fill = new SolidColorBrush(Color.FromArgb(255, 0, 255, 84)),
StackedGroupId = "stackedColumns"
});
}
if (type == typeof(StackedMountainRenderableSeriesViewModel))
{
return new PolarChartViewModel(
new StackedMountainRenderableSeriesViewModel
{
DataSeries = GetXyDataSeries(data),
Fill = new SolidColorBrush(Color.FromArgb(255, 57, 255, 0)),
StackedGroupId = "stackedMountains",
},
new StackedMountainRenderableSeriesViewModel
{
DataSeries = GetXyDataSeries(data),
Fill = new SolidColorBrush(Color.FromArgb(255, 251, 255, 0)),
StackedGroupId = "stackedMountains",
},
new StackedMountainRenderableSeriesViewModel
{
DataSeries = GetXyDataSeries(data),
Fill = new SolidColorBrush(Color.FromArgb(255, 0, 90, 255)),
StackedGroupId = "stackedMountains",
});
}
throw new NotImplementedException("Unsupported Series Type");
}
// ReSharper disable PossibleMultipleEnumeration
private static IXyDataSeries<double, double> GetXyDataSeries(IEnumerable<double> data)
{
var dataSeries = new XyDataSeries<double, double>();
dataSeries.Append(data, data);
return dataSeries;
}
private static IOhlcDataSeries<double, double> GetOhlcDataSeries(IEnumerable<double> data)
{
var dataSeries = new OhlcDataSeries<double, double>();
dataSeries.Append(data,
data.Select(x => x + 2.4),
data.Select(x => x + 4.9),
data.Select(x => x - 5.3),
data.Select(x => x - 2.7));
return dataSeries;
}
private static BoxPlotDataSeries<double, double> GetBoxSeries(IEnumerable<double> data)
{
var dataSeries = new BoxPlotDataSeries<double, double>();
dataSeries.Append(data, data,
data.Select(x => x - 2.0),
data.Select(x => x - 1.0),
data.Select(x => x + 0.5),
data.Select(x => x + 1.5));
return dataSeries;
}
private static IHlcDataSeries<double, double> GetHlcDataSeries(IEnumerable<double> data)
{
var dataSeries = new HlcDataSeries<double, double>();
dataSeries.Append(data, data, data.Select(x => x + 1.0), data.Select(x => x - 0.3));
return dataSeries;
}
private static IXyyDataSeries<double, double> GetXyyDataSeries(IEnumerable<double> data)
{
var dataSeries = new XyyDataSeries<double, double>();
dataSeries.Append(data,
data.Select(x => x % 2 == 0 ? 2 * x : x),
data.Select(x => x % 2 == 1 ? 2 * x : x));
return dataSeries;
}
private static IXyzDataSeries<double, double, double> GetXyzDataSeries(IEnumerable<double> data)
{
var dataSeries = new XyzDataSeries<double, double, double>();
dataSeries.Append(data, data, Enumerable.Repeat(30d, data.Count()));
return dataSeries;
}
// ReSharper restore PossibleMultipleEnumeration
}
}