
The Polar charts Type
Polar charts are provided not by a series type, but by an axis type. The PolarXAxis and PolarYAxis transform a standard SciChartSurface into a Polar chart.
Examples for the Polar Chart can be found in the SciChart WPF Examples Suite which can be downloaded from the SciChart Website or our SciChart.WPF.Examples Github Repository.
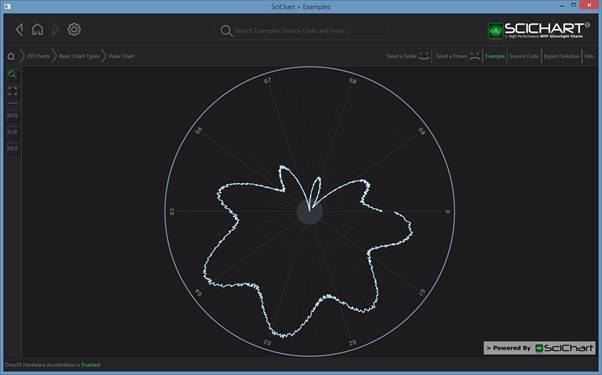
Chart Types supported by PolarXAxis and PolarYAxis
The following Chart Types are supported by PolarXAxis and PolarYAxis:
- Line Series - FastLineRenderableSeries
- Mountain Series – FastMountainRenderableSeries
- Column Series – FastColumnRenderableSeries
- Scatter Series – XyScatterRenderableSeries
- Impulse Series – FastImpulseRenderableSeries
- Candlestick Series – FastCandlestickRenderableSeries
- Ohlc Series – FastOhlcRenderableSeries
- Error Bars – FastErrorBarsRenderableSeries
- Box Plot – FastBoxPlotRenderableSeries
- Band Series – FastBandRenderableSeries
- Bubble Series – FastBubbleRenderableSeries
- Stacked Mountain – StackedMountainRenderableSeries
- Stacked Column - StackedColumnRenderableSeries
Declaring a Polar Chart in XAML
| Declaring a Polar Chart |
Copy Code |
|---|---|
<!-- Create the chart surface --> <s:SciChartSurface Padding="0"> <s:SciChartSurface.RenderableSeries> <s:FastLineRenderableSeries Stroke="#FFF" x:Name="lineSeries"/> </s:SciChartSurface.RenderableSeries> <s:SciChartSurface.XAxis> <s:PolarXAxis AutoRange="Once" DrawLabels="False" DrawMajorTicks="False" DrawMinorTicks="False" /> </s:SciChartSurface.XAxis> <s:SciChartSurface.YAxis> <s:PolarYAxis AutoRange="Once" DrawLabels="False" DrawMajorTicks="False" DrawMinorTicks="False" GrowBy="0,0.2" /> </s:SciChartSurface.YAxis> </s:SciChartSurface> // Code Behind var dataSeries = new XyDataSeries<double, double>(); // Append data to series. SciChart automatically redraws dataSeries.Append(someXData, someyData); lineSeries.DataSeries = dataSeries; | |
Declaring a Polar Chart in Code
| Declaring a Polar Chart |
Copy Code |
|---|---|
// Declare a SciChartSurface var sciChartSurface = new SciChartSurface(); // Declare Polar X and Y Axis sciChartSurface.XAxis = new PolarXAxis(); sciChartSurface.YAxis = new PolarYAxis(); // Declare a line series var lineSeries = new FastLineRenderableSeries() { Stroke = Colors.White, AntiAliasing = true, StrokeThickness = 1 }; sciChartSurface.RenderableSeries.Add(lineSeries); // Declare some data var dataSeries = new XyDataSeries<double, double>(); // Append data to series. SciChart automatically redraws dataSeries.Append(someXData, someyData); | |
NOTE: You can also declare Polar Charts using full MVVM (series ViewModels). Please see MVVM DataSeries / RenderableSeries API for more details.
Rotating a Polar Chart XAxis
New to SciChart v5.3!
It is now possible to natively rotate a polar chart's XAxis, so that the zero label is at the top of the chart. To do this, use the RotationAngle PropertyAngle property.
See Also