WPF Chart - Examples
SciChart WPF ships with hundreds of WPF Chart Examples which you can browse, play with, view the source-code and even export each WPF Chart Example to a stand-alone Visual Studio solution. All of this is possible with the new and improved SciChart WPF Examples Suite, which ships as part of the SciChart WPF SDK.
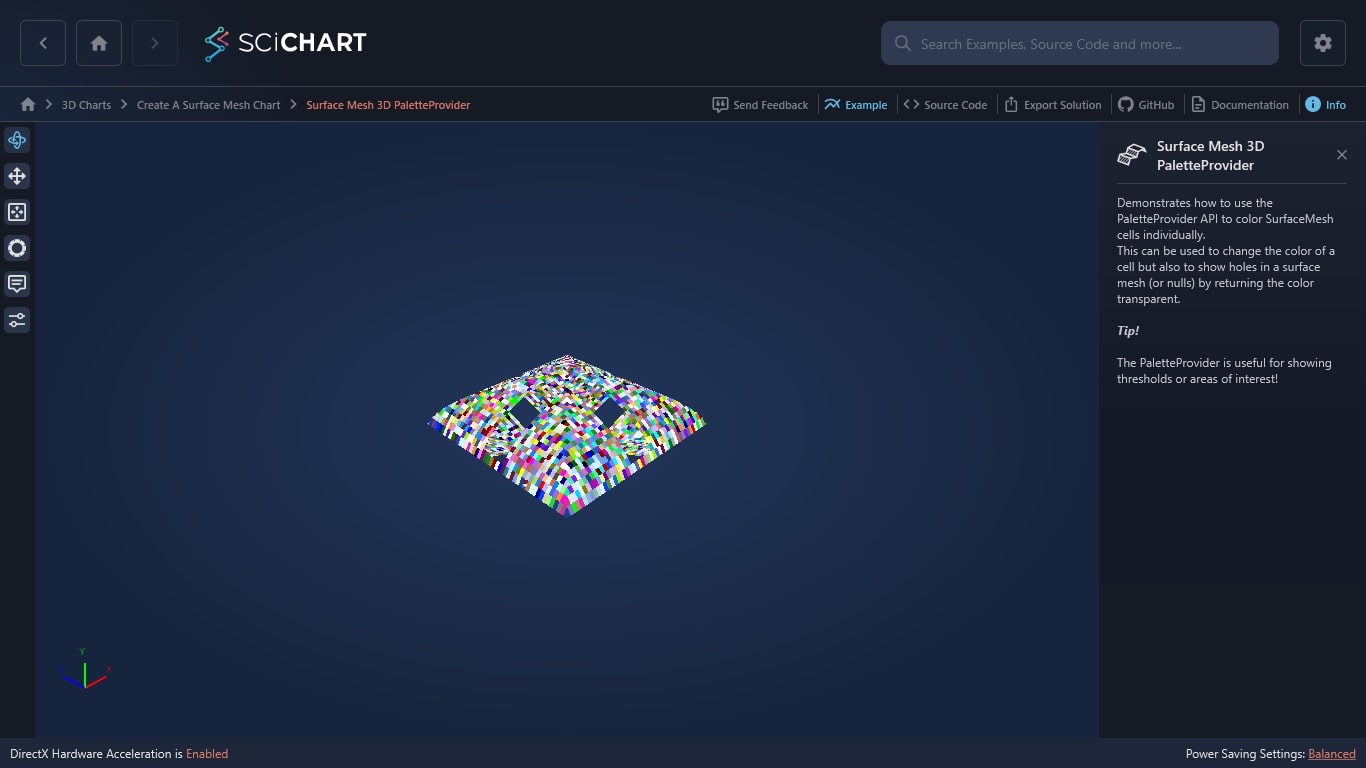
Demonstrates how to use the PaletteProvider API to color SurfaceMesh cells individually.
This can be used to change the color of a cell but also to show holes in a surface mesh (or nulls) by returning the color transparent.
Tip!
The PaletteProvider is useful for showing thresholds or areas of interest!

The C#/WPF source code for the WPF Surface Mesh 3D PaletteProvider example is included below (Scroll down!).
Did you know you can also view the source code from one of the following sources as well?
- Clone the SciChart.WPF.Examples from Github.
- Or, view source in the SciChart WPF Examples suite.
- Also the SciChart WPF Trial contains the full source for the examples (link below).
SurfaceMeshWithPaletteProvider.xaml
View source code<UserControl x:Class="SciChart.Examples.Examples.Charts3D.CreateASurfaceMeshChart.SurfaceMeshWithTextureMask"
xmlns="http://schemas.microsoft.com/winfx/2006/xaml/presentation"
xmlns:x="http://schemas.microsoft.com/winfx/2006/xaml"
xmlns:mc="http://schemas.openxmlformats.org/markup-compatibility/2006"
xmlns:d="http://schemas.microsoft.com/expression/blend/2008"
xmlns:s3D="http://schemas.abtsoftware.co.uk/scichart3D"
xmlns:ext="http://schemas.abtsoftware.co.uk/scichart/exampleExternals"
xmlns:createASurfaceMeshChart="clr-namespace:SciChart.Examples.Examples.Charts3D.CreateASurfaceMeshChart"
xmlns:s="http://schemas.abtsoftware.co.uk/scichart"
mc:Ignorable="d"
d:DesignHeight="300" d:DesignWidth="300">
<UserControl.Resources>
<Style x:Key="3DAxisStyle" TargetType="s3D:AxisBase3D">
<Setter Property="DrawMajorBands" Value="False" />
<Setter Property="DrawLabels" Value="False" />
<Setter Property="DrawMajorGridLines" Value="False" />
<Setter Property="DrawMajorTicks" Value="False" />
<Setter Property="DrawMinorGridLines" Value="False" />
<Setter Property="DrawMinorTicks" Value="False" />
</Style>
<s3D:GradientColorPalette x:Key="HeightColorMap"
ContourColor="Black"
ContourStrokeThickness="2.0">
<s3D:GradientColorPalette.GradientStops>
<GradientStop Offset="1" Color="DarkRed" />
<GradientStop Offset="0.9" Color="Red" />
<GradientStop Offset="0.8" Color="IndianRed" />
<GradientStop Offset="0.7" Color="Tomato" />
<GradientStop Offset="0.6" Color="Yellow" />
<GradientStop Offset="0.5" Color="GreenYellow" />
<GradientStop Offset="0.4" Color="LimeGreen" />
<GradientStop Offset="0.3" Color="Cyan" />
<GradientStop Offset="0.2" Color="CadetBlue" />
<GradientStop Offset="0.1" Color="Blue" />
<GradientStop Offset="0.0" Color="DarkBlue" />
</s3D:GradientColorPalette.GradientStops>
</s3D:GradientColorPalette>
<createASurfaceMeshChart:SurfaceMeshPaletteProvider3D x:Key="MeshPaletteProvider3D"/>
<Style x:Key="TooltipStyle2" TargetType="s:TooltipControl">
<Setter Property="Template">
<Setter.Value>
<ControlTemplate TargetType="s:TooltipControl">
<Border Background="Coral"
BorderBrush="Coral"
BorderThickness="3"
Opacity="0.9"
Padding="5">
<ContentPresenter Content="{TemplateBinding DataContext}" ContentTemplate="{TemplateBinding ContentTemplate}" />
</Border>
</ControlTemplate>
</Setter.Value>
</Setter>
</Style>
<Style x:Key="TooltipStyle" TargetType="s:TooltipControl">
<Setter Property="Template">
<Setter.Value>
<ControlTemplate TargetType="s:TooltipControl">
<Border Background="White"
BorderBrush="#ff4d81dd"
BorderThickness="2"
Opacity="0.9"
Padding="5">
<ContentPresenter Content="{TemplateBinding DataContext}" ContentTemplate="{TemplateBinding ContentTemplate}" />
</Border>
</ControlTemplate>
</Setter.Value>
</Setter>
</Style>
<ext:LinearToLogarithmicValueConverter x:Key="LinearToLogarithmicValueConverter"/>
</UserControl.Resources>
<Grid>
<Grid.ColumnDefinitions>
<ColumnDefinition Width="Auto" />
<ColumnDefinition Width="*" />
</Grid.ColumnDefinitions>
<ext:SciChart3DInteractionToolbar Grid.Column="0" TargetSurface="{Binding Source={x:Reference Name=SciChart}}">
<ext:FlyoutMenuButton Style="{StaticResource FlyoutMenuButtonStyle}"
Content="CTRL"
FontSize="10"
Padding="0">
<ext:FlyoutMenuButton.PopupContent>
<StackPanel Orientation="Vertical" MinWidth="150">
<TextBlock FontSize="12" Text="Lighting Factor" />
<Slider Minimum="0.0" Maximum="1.0" x:Name="lightingFactorSlider" Value="0.0" Margin="4" Orientation="Horizontal" HorizontalAlignment="Stretch"/>
<TextBlock FontSize="12" Text="Shininess" />
<Slider Minimum="0" Maximum="11" x:Name="shininessSlider" Margin="4" Orientation="Horizontal" HorizontalAlignment="Stretch"/>
</StackPanel>
</ext:FlyoutMenuButton.PopupContent>
</ext:FlyoutMenuButton>
</ext:SciChart3DInteractionToolbar>
<s3D:SciChart3DSurface x:Name="SciChart"
Grid.Column="1"
BorderThickness="0">
<s3D:SciChart3DSurface.RenderableSeries>
<s3D:SurfaceMeshRenderableSeries3D x:Name="surfaceMeshRenderableSeries"
DrawMeshAs="SolidMesh"
DrawSkirt="False"
LightingFactor="{Binding Source={x:Reference Name=lightingFactorSlider}, Path=Value, Mode=TwoWay}"
Shininess="{Binding ElementName=shininessSlider, Path=Value, Mode=TwoWay, Converter={StaticResource LinearToLogarithmicValueConverter}}"
MeshColorPalette="{StaticResource HeightColorMap}"
s3D:TooltipModifier3D.TooltipContainerStyle="{StaticResource TooltipStyle2}"
PaletteProvider="{StaticResource MeshPaletteProvider3D}"/>
<s3D:SurfaceMeshRenderableSeries3D x:Name="surfaceMeshRenderableSeries2"
DrawMeshAs="SolidMesh"
DrawSkirt="False"
LightingFactor="{Binding Source={x:Reference Name=lightingFactorSlider}, Path=Value, Mode=TwoWay}"
Shininess="{Binding ElementName=shininessSlider, Path=Value, Mode=TwoWay, Converter={StaticResource LinearToLogarithmicValueConverter}}"
MeshColorPalette="{StaticResource HeightColorMap}"
s3D:TooltipModifier3D.TooltipContainerStyle="{StaticResource TooltipStyle}"
PaletteProvider="{StaticResource MeshPaletteProvider3D}"/>
</s3D:SciChart3DSurface.RenderableSeries>
<s3D:SciChart3DSurface.XAxis>
<s3D:NumericAxis3D Style="{StaticResource 3DAxisStyle}" PlaneBorderThickness="0.0" />
</s3D:SciChart3DSurface.XAxis>
<s3D:SciChart3DSurface.YAxis>
<s3D:NumericAxis3D Style="{StaticResource 3DAxisStyle}" PlaneBorderThickness="0.0" />
</s3D:SciChart3DSurface.YAxis>
<s3D:SciChart3DSurface.ZAxis>
<s3D:NumericAxis3D Style="{StaticResource 3DAxisStyle}" PlaneBorderThickness="0.0" />
</s3D:SciChart3DSurface.ZAxis>
<s3D:SciChart3DSurface.ChartModifier>
<s3D:ModifierGroup3D>
<s3D:TooltipModifier3D CrosshairMode="None" IsEnabled="False" />
<s3D:MouseWheelZoomModifier3D />
</s3D:ModifierGroup3D>
</s3D:SciChart3DSurface.ChartModifier>
</s3D:SciChart3DSurface>
</Grid>
</UserControl>SurfaceMeshWithPaletteProvider.xaml.cs
View source codeusing System;
using System.Collections.Generic;
using System.Linq;
using System.Text;
using System.Windows;
using System.Windows.Controls;
using System.Windows.Data;
using System.Windows.Documents;
using System.Windows.Input;
using System.Windows.Media;
using System.Windows.Media.Imaging;
using System.Windows.Navigation;
using System.Windows.Shapes;
using System.Windows.Threading;
using SciChart.Charting.Model.DataSeries;
using SciChart.Charting3D.Model;
using SciChart.Charting3D.RenderableSeries;
namespace SciChart.Examples.Examples.Charts3D.CreateASurfaceMeshChart
{
/// <summary>
/// Interaction logic for SurfaceMeshWithTextureMask.xaml
/// </summary>
public partial class SurfaceMeshWithTextureMask : UserControl
{
private DispatcherTimer _timer;
private UniformGridDataSeries3D<double> _meshDataSeries0;
private UniformGridDataSeries3D<double> _meshDataSeries1;
public SurfaceMeshWithTextureMask()
{
InitializeComponent();
int xSize = 49;
int zSize = 49;
_meshDataSeries0 = new UniformGridDataSeries3D<double>(xSize, zSize);
_meshDataSeries1 = new UniformGridDataSeries3D<double>(xSize, zSize);
for (int x = 48; x >= 24; x--)
{
var y = Math.Pow((double)x - 23 - 0.7, 0.3);
_meshDataSeries0[24, x] = y;
var y2 = Math.Pow((double)(x - 49) * (-1) + 0.5, 0.3);
_meshDataSeries1[24, x] = y2 + 1.505;
}
for (int x = 24; x >= 0; x--)
{
for (int z = 49; z > 25; z--)
{
var y = Math.Pow((double)z - 23 - 0.7, 0.3);
var y2 = Math.Pow((double)(z - 50) * (-1) + 0.5, 0.3);
_meshDataSeries0[x + 24, (z - 49) * (-1)] = y;
_meshDataSeries0[z - 1, (x - 24) * (-1)] = y;
_meshDataSeries1[x + 24, (z - 49) * (-1)] = y2 + 1.505;
_meshDataSeries1[z - 1, (x - 24) * (-1)] = y2 + 1.505;
_meshDataSeries0[(x - 24) * (-1), (z - 49) * (-1)] = y;
_meshDataSeries0[(z - 49) * (-1), (x - 24) * (-1)] = y;
_meshDataSeries1[(x - 24) * (-1), (z - 49) * (-1)] = y2 + 1.505;
_meshDataSeries1[(z - 49) * (-1), (x - 24) * (-1)] = y2 + 1.505;
_meshDataSeries0[x + 24, z - 1] = y;
_meshDataSeries0[z - 1, x + 24] = y;
_meshDataSeries1[x + 24, z - 1] = y2 + 1.505;
_meshDataSeries1[z - 1, x + 24] = y2 + 1.505;
_meshDataSeries0[(x - 24) * (-1), z - 1] = y;
_meshDataSeries0[(z - 49) * (-1), x + 24] = y;
_meshDataSeries1[(x - 24) * (-1), z - 1] = y2 + 1.505;
_meshDataSeries1[(z - 49) * (-1), x + 24] = y2 + 1.505;
}
}
if (_timer == null)
{
_timer = new DispatcherTimer(DispatcherPriority.Render);
_timer.Interval = TimeSpan.FromMilliseconds(1);
_timer.Tick += OnTimerTick;
}
_timer.Start();
surfaceMeshRenderableSeries.Maximum = (double)_meshDataSeries1.YRange.Max;
surfaceMeshRenderableSeries.Minimum = (double)_meshDataSeries0.YRange.Min;
surfaceMeshRenderableSeries.DataSeries = _meshDataSeries0;
surfaceMeshRenderableSeries2.Maximum = (double)_meshDataSeries1.YRange.Max;
surfaceMeshRenderableSeries2.Minimum = (double)_meshDataSeries0.YRange.Min;
surfaceMeshRenderableSeries2.DataSeries = _meshDataSeries1;
}
private void OnTimerTick(object sender, EventArgs e)
{
// Raise DataSeriesChanged event and trigger chart updates
_meshDataSeries0.IsDirty = true;
_meshDataSeries0.OnDataSeriesChanged(DataSeriesUpdate.DataChanged, DataSeriesAction.Update);
_meshDataSeries1.IsDirty = true;
_meshDataSeries1.OnDataSeriesChanged(DataSeriesUpdate.DataChanged, DataSeriesAction.Update);
}
}
public class SurfaceMeshPaletteProvider3D : ISurfaceMeshPaletteProvider3D
{
private List<Color> _colors;
private Random _random;
public void OnAttach(IRenderableSeries3D renderSeries)
{
_colors = GetCashedColorsCollection();
_random = new Random();
}
public void OnDetached()
{
_colors = null;
}
/// <summary>
/// Returns a collection of cached brushes
/// </summary>
/// <returns></returns>
private List<Color> GetCashedColorsCollection()
{
return typeof(Colors).GetProperties().Select(x => (Color)x.GetValue(null, null)).ToList();
}
public Color? OverrideCellColor(IRenderableSeries3D series, int xIndex, int zIndex)
{
if (zIndex == 0 || xIndex == 0 ||
zIndex == 47 || xIndex == 47)
{
return _colors[_random.Next(1, _colors.Count())];
}
else if ((zIndex >= 20 && zIndex <= 26) || (xIndex >= 20 && xIndex <= 26))
{
return (Color?)Colors.Transparent;
}
return _colors[_random.Next(1, _colors.Count())];
}
}
}