WPF Chart - Examples
SciChart WPF ships with hundreds of WPF Chart Examples which you can browse, play with, view the source-code and even export each WPF Chart Example to a stand-alone Visual Studio solution. All of this is possible with the new and improved SciChart WPF Examples Suite, which ships as part of the SciChart WPF SDK.
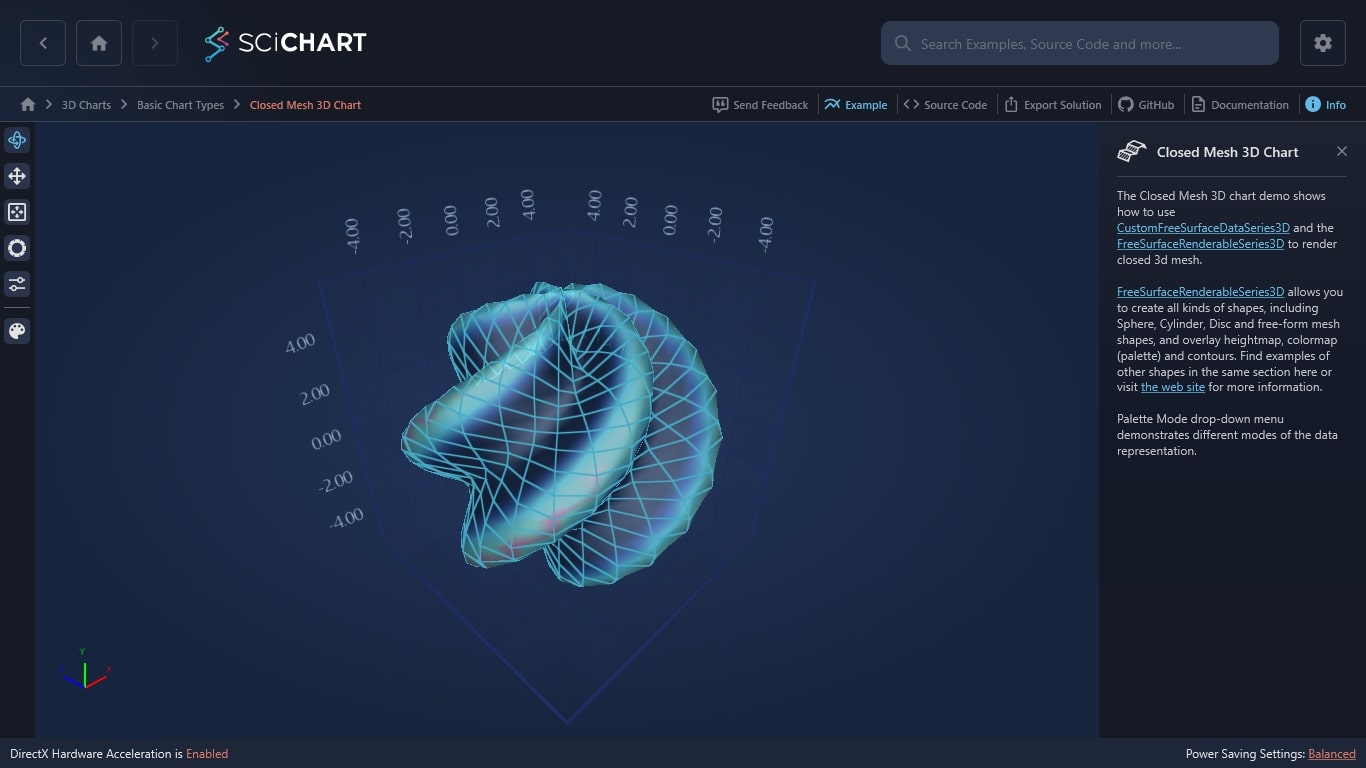
The Closed Mesh 3D chart demo shows how to use CustomFreeSurfaceDataSeries3D and the FreeSurfaceRenderableSeries3D to render closed 3d mesh.
FreeSurfaceRenderableSeries3D allows you to create all kinds of shapes, including Sphere, Cylinder, Disc and free-form mesh shapes, and overlay heightmap, colormap (palette) and contours. Find examples of other shapes in the same section here or visit the web site for more information.
Palette Mode drop-down menu demonstrates different modes of the data representation.
The C#/WPF source code for the WPF 3D Closed Mesh Chart Example example is included below (Scroll down!).
Did you know you can also view the source code from one of the following sources as well?
- Clone the SciChart.WPF.Examples from Github.
- Or, view source in the SciChart WPF Examples suite.
- Also the SciChart WPF Trial contains the full source for the examples (link below).


