WPF Chart - Examples
SciChart WPF ships with hundreds of WPF Chart Examples which you can browse, play with, view the source-code and even export each WPF Chart Example to a stand-alone Visual Studio solution. All of this is possible with the new and improved SciChart WPF Examples Suite, which ships as part of the SciChart WPF SDK.
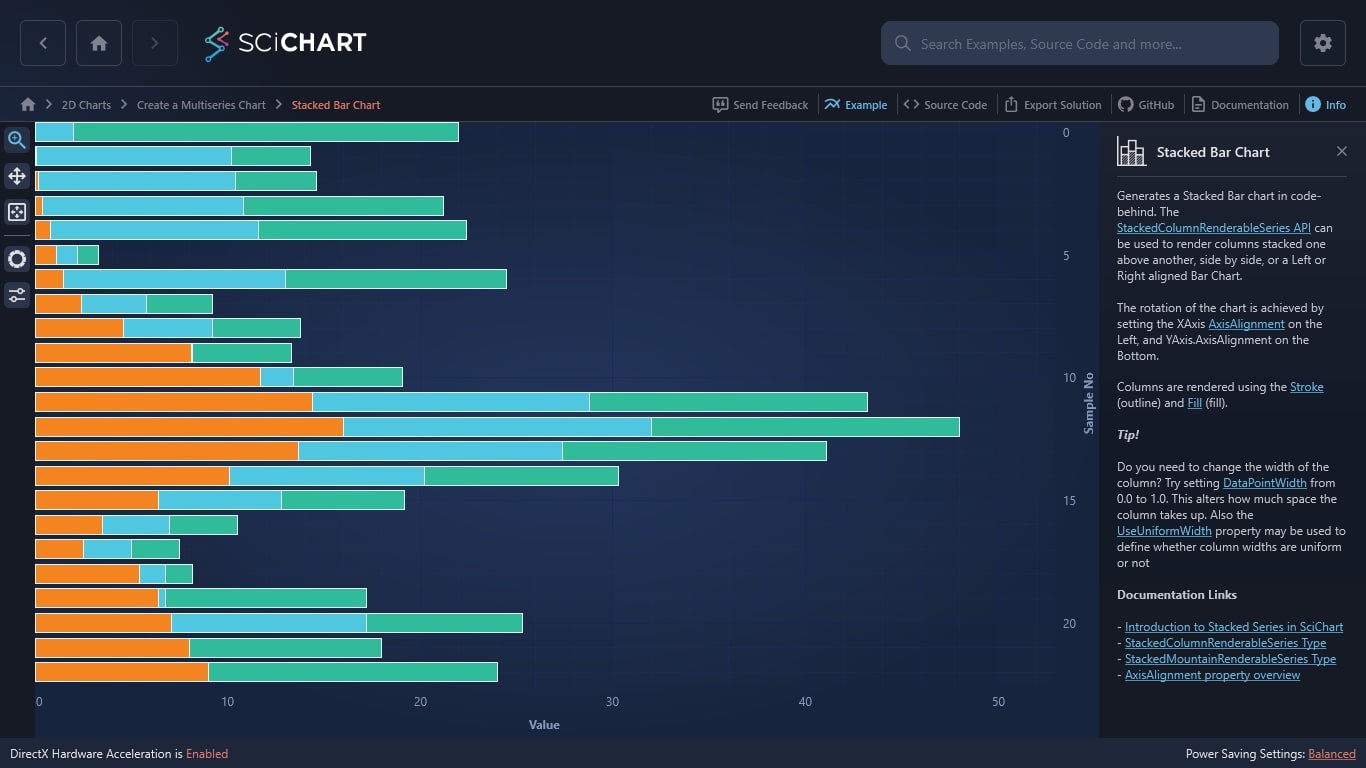
Looking to generate a WPF Stacked Bar Chart in code-behind? In SciChart’s award-winning WPF Chart Library, StackedColumnRenderableSeries API can be used to render columns stacked one above another, side by side, or a Left or Right aligned Bar Chart.
The rotation of the chart is achieved by setting the XAxis AxisAlignment on the Left, and YAxis.AxisAlignment on the Bottom.
Columns are rendered using the Stroke (outline) and Fill (fill).
We support enterprise-level WPF chart applications across a wide range of sectors including: motorsports, healthcare, financial, trading, robotics, research and more. If you’re looking for high performance WPF charts, we have the software you want.
SciChart Tip!
Do you need to change the width of the column? Try setting DataPointWidth from 0.0 to 1.0. This alters how much space the column takes up. Also the UseUniformWidth property may be used to define whether column widths are uniform or not.
Documentation Links
– Introduction to Stacked Series in SciChart
– StackedColumnRenderableSeries Type
– StackedMountainRenderableSeries Type
– AxisAlignment property overview
Ready to create a WPF Stacked Bar Chart?
The C#/WPF source code for the WPF Bar Chart example is included below.
You can also view the source code from one of the following sources:
- Clone the SciChart.WPF.Examples from Github.
- Or, view source in the SciChart WPF Examples suite.
- Also, the SciChart WPF Trial contains the full source for the examples.
Download the WPF bar chart examples or begin your free trial today.
How to get started
Ready to get started with your free 30-day trial? Read our Getting Started guide before you do – it teaches you how to…
- Begin your free trial
- Create charts with tutorials
- Compile example source code
- Access documentation
So, what are you waiting for? Bring that project you’ve been thinking about to life with a free trial of SciChart.WPF. No credit card details required.
Get started with your free trial today
Why use SciChart?
- Fast rendering for real-time data feeds
- Supports endless customisable & interactive features
- 5-star rated support for developers
- Winner of the Queen’s Award for Innovation
- Extensive features built for complex charts
- 98% of users recommend SciChart
Frequently Asked Questions
How fast are your WPF stacked bar charts?
SciChart WPF is 10 to 100 x times faster than competitors, able to draw millions or even billions of data points in Big Data Apps. This makes SciChart the world’s fastest Big-Data WPF Chart component for complex, real-world applications.
What support is available for our developers?
At SciChart, we’re known for providing next-level, responsive technical support. It’s easy to get in touch with our team, who typically respond within one business day.
What can I do with the free trial?
The free trial will give one developer access to all our WPF charting software so you can supercharge your dashboards and web applications. It lasts for 30 days and at the end of your trial you’ll have the option to purchase a licence. If you need help choosing the right package for your data visualization requirements, you can contact our team who will be more than happy to help.

The C#/WPF source code for the WPF Stacked Bar Chart example is included below (Scroll down!).
Did you know you can also view the source code from one of the following sources as well?
- Clone the SciChart.WPF.Examples from Github.
- Or, view source in the SciChart WPF Examples suite.
- Also the SciChart WPF Trial contains the full source for the examples (link below).
StackedBarChartExampleView.xaml
View source code<UserControl x:Class="SciChart.Examples.Examples.CreateMultiseriesChart.StackedBarChartExampleView"
xmlns="http://schemas.microsoft.com/winfx/2006/xaml/presentation"
xmlns:x="http://schemas.microsoft.com/winfx/2006/xaml"
xmlns:s="http://schemas.abtsoftware.co.uk/scichart"
xmlns:mc="http://schemas.openxmlformats.org/markup-compatibility/2006"
xmlns:d="http://schemas.microsoft.com/expression/blend/2008"
xmlns:ext="http://schemas.abtsoftware.co.uk/scichart/exampleExternals"
d:DesignHeight="400"
d:DesignWidth="600"
mc:Ignorable="d">
<UserControl.Resources>
<LinearGradientBrush StartPoint="0,0" EndPoint="0,1" x:Key="chartFill0">
<GradientStop Offset="0" Color="#567893" />
<GradientStop Offset="1.0" Color="#3D5568" />
</LinearGradientBrush>
<LinearGradientBrush StartPoint="0,0" EndPoint="0,1" x:Key="chartFill1">
<GradientStop Offset="0" Color="#ACBCCA" />
<GradientStop Offset="1.0" Color="#439AAF" />
</LinearGradientBrush>
<LinearGradientBrush StartPoint="0,0" EndPoint="0,1" x:Key="chartFill2">
<GradientStop Offset="0" Color="#DBE0E1" />
<GradientStop Offset="1.0" Color="#B6C1C3" />
</LinearGradientBrush>
</UserControl.Resources>
<Grid>
<Grid.ColumnDefinitions>
<ColumnDefinition Width="Auto" />
<ColumnDefinition Width="*" />
</Grid.ColumnDefinitions>
<!-- The SciChartInteractionToolbar adds zoom, pan, zoom extents and rotate functionality -->
<!-- to the chart and is included for example purposes. -->
<!-- If you wish to know how to zoom and pan a chart then do a search for Zoom Pan in the Examples suite! -->
<ext:SciChartInteractionToolbar TargetSurface="{Binding Source={x:Reference Name=sciChart}}" >
<ext:FlyoutMenuButton Style="{StaticResource FlyoutMenuButtonStyle}" Content="AXIS" Padding="0">
<ext:FlyoutMenuButton.PopupContent>
<StackPanel Orientation="Vertical" MinWidth="150" Margin="0,0,0,4">
<TextBlock Text="YAxis.AxisAlignment" />
<ext:FlyoutSeparator/>
<ComboBox SelectionChanged="CboYAxisAlignment_OnSelectionChanged" Margin="4" x:Name="cboYAxisAlignment" SelectedIndex="0">
<ComboBox.Items>
<s:AxisAlignment>Bottom</s:AxisAlignment>
<s:AxisAlignment>Top</s:AxisAlignment>
<s:AxisAlignment>Right</s:AxisAlignment>
<s:AxisAlignment>Left</s:AxisAlignment>
</ComboBox.Items>
</ComboBox>
<TextBlock Text="Xaxis.AxisAlignment" />
<ext:FlyoutSeparator/>
<ComboBox SelectionChanged="CboXAxisAlignment_OnSelectionChanged" Margin="4" x:Name="cboXAxisAlignment" SelectedIndex="0">
<ComboBox.Items>
<s:AxisAlignment>Right</s:AxisAlignment>
<s:AxisAlignment>Left</s:AxisAlignment>
<s:AxisAlignment>Bottom</s:AxisAlignment>
<s:AxisAlignment>Top</s:AxisAlignment>
</ComboBox.Items>
</ComboBox>
</StackPanel>
</ext:FlyoutMenuButton.PopupContent>
</ext:FlyoutMenuButton>
</ext:SciChartInteractionToolbar>
<!-- Create the chart surface -->
<s:SciChartSurface Name="sciChart"
Grid.Column="1"
Padding="0"
BorderThickness="0">
<!-- Declare RenderableSeries -->
<s:SciChartSurface.RenderableSeries>
<s:StackedColumnRenderableSeries x:Name="columnSeries1" DataPointWidth="0.8" Stroke="#333" Fill="{StaticResource chartFill0}">
<s:StackedColumnRenderableSeries.SeriesAnimation>
<s:SweepAnimation AnimationDelay="0:0:1" Duration="0:0:3"/>
</s:StackedColumnRenderableSeries.SeriesAnimation>
</s:StackedColumnRenderableSeries>
<s:StackedColumnRenderableSeries x:Name="columnSeries2" Stroke="#333" Fill="{StaticResource chartFill1}">
<s:StackedColumnRenderableSeries.SeriesAnimation>
<s:SweepAnimation AnimationDelay="0:0:1" Duration="0:0:3"/>
</s:StackedColumnRenderableSeries.SeriesAnimation>
</s:StackedColumnRenderableSeries>
<s:StackedColumnRenderableSeries x:Name="columnSeries3" Stroke="#333" Fill="{StaticResource chartFill2}">
<s:StackedColumnRenderableSeries.SeriesAnimation>
<s:SweepAnimation AnimationDelay="0:0:1" Duration="0:0:3"/>
</s:StackedColumnRenderableSeries.SeriesAnimation>
</s:StackedColumnRenderableSeries>
</s:SciChartSurface.RenderableSeries>
<!-- Create an X Axis -->
<s:SciChartSurface.XAxis>
<s:NumericAxis x:Name="numericXAxis" AxisAlignment="Right" AxisTitle="Sample No"/>
</s:SciChartSurface.XAxis>
<!-- Create a Y Axis with GrowBy -->
<s:SciChartSurface.YAxis>
<s:NumericAxis x:Name="numericYAxis" AxisAlignment="Bottom" AxisTitle="Value" GrowBy="0,0.1" FlipCoordinates="True" />
</s:SciChartSurface.YAxis>
</s:SciChartSurface>
</Grid>
</UserControl>StackedBarChartExampleView.xaml.cs
View source code// *************************************************************************************
// SCICHART® Copyright SciChart Ltd. 2011-2022. All rights reserved.
//
// Web: http://www.scichart.com
// Support: support@scichart.com
// Sales: sales@scichart.com
//
// StackedBarChartExampleView.xaml.cs is part of the SCICHART® Examples. Permission is hereby granted
// to modify, create derivative works, distribute and publish any part of this source
// code whether for commercial, private or personal use.
//
// The SCICHART® examples are distributed in the hope that they will be useful, but
// without any warranty. It is provided "AS IS" without warranty of any kind, either
// expressed or implied.
// *************************************************************************************
using System.Windows.Controls;
using SciChart.Charting.Model.DataSeries;
using SciChart.Charting.Visuals.Axes;
namespace SciChart.Examples.Examples.CreateMultiseriesChart
{
/// <summary>
/// Interaction logic for StackedBarChartExampleView.xaml
/// </summary>
public partial class StackedBarChartExampleView
{
private bool _firstTimeRendered;
public StackedBarChartExampleView()
{
InitializeComponent();
sciChart.Rendered += (o, args) =>
{
if (!_firstTimeRendered)
{
_firstTimeRendered = true;
sciChart.ZoomExtents();
}
};
var yValues1 = new[] { 0.0, 0.1, 0.2, 0.4, 0.8, 1.1, 1.5, 2.4, 4.6, 8.1, 11.7, 14.4, 16.0, 13.7, 10.1, 6.4, 3.5, 2.5, 5.4, 6.4, 7.1, 8.0, 9.0 };
var yValues2 = new[] { 2.0, 10.1, 10.2, 10.4, 10.8, 1.1, 11.5, 3.4, 4.6, 0.1, 1.7, 14.4, 16.0, 13.7, 10.1, 6.4, 3.5, 2.5, 1.4, 0.4, 10.1, 0.0, 0.0 };
var yValues3 = new[] { 20.0, 4.1, 4.2, 10.4, 10.8, 1.1, 11.5, 3.4, 4.6, 5.1, 5.7, 14.4, 16.0, 13.7, 10.1, 6.4, 3.5, 2.5, 1.4, 10.4, 8.1, 10.0, 15.0 };
var dataSeries1 = new UniformXyDataSeries<double> { SeriesName = "data1" };
var dataSeries2 = new UniformXyDataSeries<double> { SeriesName = "data2" };
var dataSeries3 = new UniformXyDataSeries<double> { SeriesName = "data3" };
for (int i = 0; i < yValues1.Length; i++) dataSeries1.Append(yValues1[i]);
for (int i = 0; i < yValues2.Length; i++) dataSeries2.Append(yValues2[i]);
for (int i = 0; i < yValues3.Length; i++) dataSeries3.Append(yValues3[i]);
using (sciChart.SuspendUpdates())
{
columnSeries1.DataSeries = dataSeries1;
columnSeries2.DataSeries = dataSeries2;
columnSeries3.DataSeries = dataSeries3;
}
}
private void CboXAxisAlignment_OnSelectionChanged(object sender, SelectionChangedEventArgs e)
{
if (numericXAxis != null)
{
numericXAxis.AxisAlignment = (AxisAlignment)cboXAxisAlignment.SelectedValue;
}
}
private void CboYAxisAlignment_OnSelectionChanged(object sender, SelectionChangedEventArgs e)
{
if (numericXAxis != null)
{
numericYAxis.AxisAlignment = (AxisAlignment)cboYAxisAlignment.SelectedValue;
}
}
}
}