WPF Chart - Examples
SciChart WPF ships with hundreds of WPF Chart Examples which you can browse, play with, view the source-code and even export each WPF Chart Example to a stand-alone Visual Studio solution. All of this is possible with the new and improved SciChart WPF Examples Suite, which ships as part of the SciChart WPF SDK.
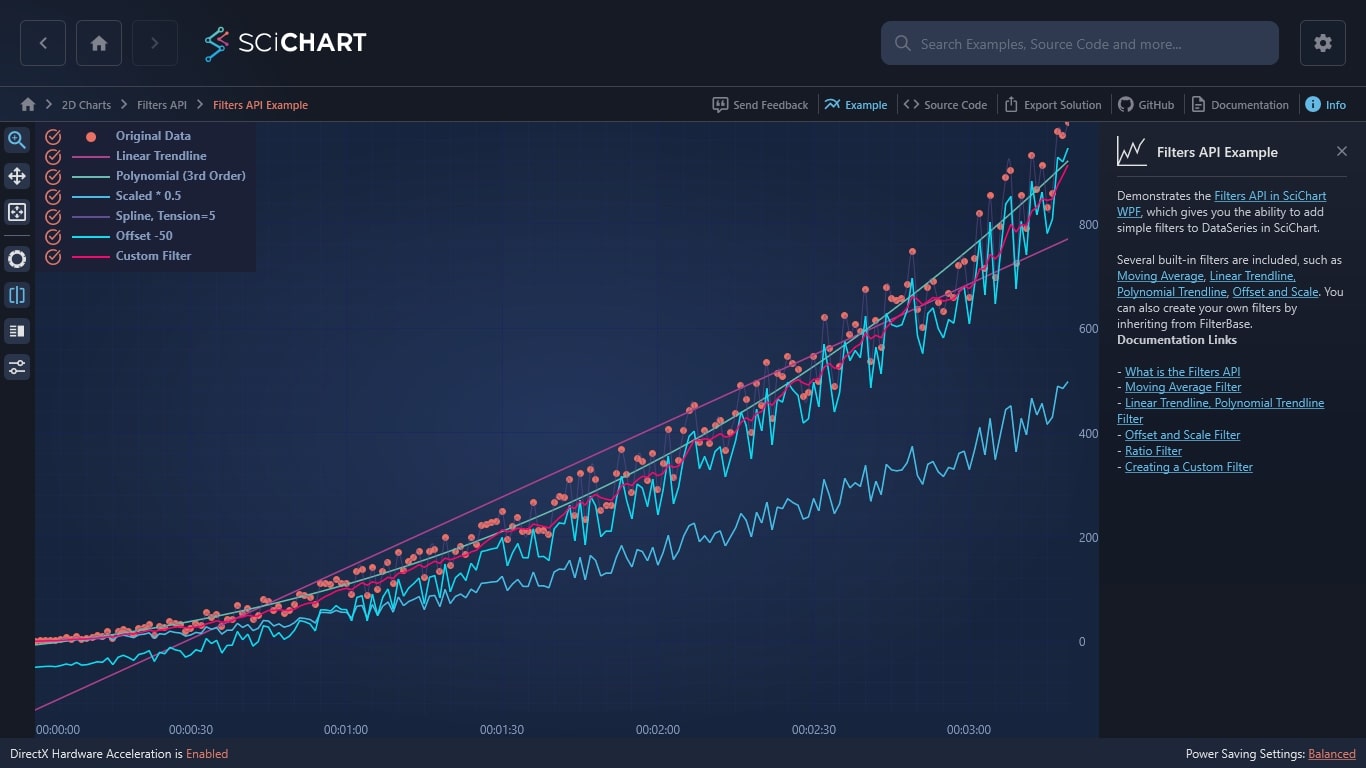
Demonstrates the Filters API in SciChart WPF charts, which gives you the ability to add simple filters to DataSeries in SciChart.
Several built-in filters are included, such as Moving Average, Linear Trendline, Polynomial Trendline, Offset and Scale. You can also create your own filters by inheriting from FilterBase.
Documentation Links
– What is the Filters API
– Moving Average Filter
– Linear Trendline, Polynomial Trendline Filter
– Offset and Scale Filter
– Ratio Filter
– Creating a Custom Filter

The C#/WPF source code for the WPF Chart Filters API Example example is included below (Scroll down!).
Did you know you can also view the source code from one of the following sources as well?
- Clone the SciChart.WPF.Examples from Github.
- Or, view source in the SciChart WPF Examples suite.
- Also the SciChart WPF Trial contains the full source for the examples (link below).
FiltersApiExample.xaml
View source code<UserControl x:Class="SciChart.Examples.Examples.FiltersAPI.FiltersAPIExample"
xmlns="http://schemas.microsoft.com/winfx/2006/xaml/presentation"
xmlns:x="http://schemas.microsoft.com/winfx/2006/xaml"
xmlns:mc="http://schemas.openxmlformats.org/markup-compatibility/2006"
xmlns:d="http://schemas.microsoft.com/expression/blend/2008"
xmlns:local="clr-namespace:SciChart.Examples.Examples.FiltersAPI"
xmlns:s="http://schemas.abtsoftware.co.uk/scichart"
xmlns:ext="http://schemas.abtsoftware.co.uk/scichart/exampleExternals"
mc:Ignorable="d"
Loaded="FiltersAPIExample_Loaded"
d:DesignHeight="400" d:DesignWidth="600">
<Grid>
<Grid.ColumnDefinitions>
<ColumnDefinition Width="Auto" />
<ColumnDefinition Width="*" />
</Grid.ColumnDefinitions>
<!-- The SciChartInteractionToolbar adds zoom, pan, zoom extents and rotate functionality -->
<!-- to the chart and is included for example purposes. -->
<!-- If you wish to know how to zoom and pan a chart then do a search for Zoom Pan in the Examples suite! -->
<ext:SciChartInteractionToolbar TargetSurface="{Binding Source={x:Reference Name=sciChart}}" >
<ext:FlyoutMenuButton Style="{StaticResource FlyoutMenuButtonStyle}" Content="OPT">
<ext:FlyoutMenuButton.PopupContent>
<StackPanel Orientation="Vertical">
<TextBlock Text="Slide to change Randomness of Data" />
<ext:FlyoutSeparator/>
<!-- Create the Z slider -->
<Slider Minimum="0.05" Maximum="5.0" x:Name="randomSlider" ValueChanged="Slider_OnValueChanged" Value="1.0" Margin="4" Orientation="Horizontal" HorizontalAlignment="Stretch"/>
<TextBlock Text="Slide to change Slope of Data" />
<ext:FlyoutSeparator/>
<!-- Create the Z slider -->
<Slider Minimum="0.01" Maximum="0.5" x:Name="slopeSlider" ValueChanged="Slider_OnValueChanged" Value="0.01" Margin="4" Orientation="Horizontal" HorizontalAlignment="Stretch"/>
</StackPanel>
</ext:FlyoutMenuButton.PopupContent>
</ext:FlyoutMenuButton>
</ext:SciChartInteractionToolbar>
<s:SciChartSurface Grid.Column="1"
x:Name="sciChart">
<s:SciChartSurface.XAxis>
<s:TimeSpanAxis/>
</s:SciChartSurface.XAxis>
<s:SciChartSurface.YAxis>
<s:NumericAxis/>
</s:SciChartSurface.YAxis>
<s:SciChartSurface.ChartModifier>
<s:ModifierGroup>
<s:RolloverModifier ShowTooltipOn="MouseHover" />
<s:LegendModifier ShowLegend="True"/>
</s:ModifierGroup>
</s:SciChartSurface.ChartModifier>
</s:SciChartSurface>
</Grid>
</UserControl>
FiltersAPIExample.xaml.cs
View source code<UserControl x:Class="SciChart.Examples.Examples.FiltersAPI.FiltersAPIExample"
xmlns="http://schemas.microsoft.com/winfx/2006/xaml/presentation"
xmlns:x="http://schemas.microsoft.com/winfx/2006/xaml"
xmlns:mc="http://schemas.openxmlformats.org/markup-compatibility/2006"
xmlns:d="http://schemas.microsoft.com/expression/blend/2008"
xmlns:local="clr-namespace:SciChart.Examples.Examples.FiltersAPI"
xmlns:s="http://schemas.abtsoftware.co.uk/scichart"
xmlns:ext="http://schemas.abtsoftware.co.uk/scichart/exampleExternals"
mc:Ignorable="d"
Loaded="FiltersAPIExample_Loaded"
d:DesignHeight="400" d:DesignWidth="600">
<Grid>
<Grid.ColumnDefinitions>
<ColumnDefinition Width="Auto" />
<ColumnDefinition Width="*" />
</Grid.ColumnDefinitions>
<!-- The SciChartInteractionToolbar adds zoom, pan, zoom extents and rotate functionality -->
<!-- to the chart and is included for example purposes. -->
<!-- If you wish to know how to zoom and pan a chart then do a search for Zoom Pan in the Examples suite! -->
<ext:SciChartInteractionToolbar TargetSurface="{Binding Source={x:Reference Name=sciChart}}" >
<ext:FlyoutMenuButton Style="{StaticResource FlyoutMenuButtonStyle}" Content="OPT">
<ext:FlyoutMenuButton.PopupContent>
<StackPanel Orientation="Vertical">
<TextBlock Text="Slide to change Randomness of Data" />
<ext:FlyoutSeparator/>
<!-- Create the Z slider -->
<Slider Minimum="0.05" Maximum="5.0" x:Name="randomSlider" ValueChanged="Slider_OnValueChanged" Value="1.0" Margin="4" Orientation="Horizontal" HorizontalAlignment="Stretch"/>
<TextBlock Text="Slide to change Slope of Data" />
<ext:FlyoutSeparator/>
<!-- Create the Z slider -->
<Slider Minimum="0.01" Maximum="0.5" x:Name="slopeSlider" ValueChanged="Slider_OnValueChanged" Value="0.01" Margin="4" Orientation="Horizontal" HorizontalAlignment="Stretch"/>
</StackPanel>
</ext:FlyoutMenuButton.PopupContent>
</ext:FlyoutMenuButton>
</ext:SciChartInteractionToolbar>
<s:SciChartSurface Grid.Column="1"
x:Name="sciChart">
<s:SciChartSurface.XAxis>
<s:TimeSpanAxis/>
</s:SciChartSurface.XAxis>
<s:SciChartSurface.YAxis>
<s:NumericAxis/>
</s:SciChartSurface.YAxis>
<s:SciChartSurface.ChartModifier>
<s:ModifierGroup>
<s:RolloverModifier ShowTooltipOn="MouseHover" />
<s:LegendModifier ShowLegend="True"/>
</s:ModifierGroup>
</s:SciChartSurface.ChartModifier>
</s:SciChartSurface>
</Grid>
</UserControl>
CustomFilter.cs
View source codeusing System;
using SciChart.Charting.Model.DataSeries;
using SciChart.Charting.Model.Filters;
namespace SciChart.Examples.Examples.FiltersAPI
{
/// <summary>
/// To create a custom filter, inherit FilterBase and override FilterALl. For best performance, you can also override FilterOnAppend
/// </summary>
public class CustomFilter : FilterBase
{
private readonly XyDataSeries<TimeSpan, double> _originalDataSeries;
private readonly XyDataSeries<TimeSpan, double> _filteredDataSeries = new XyDataSeries<TimeSpan, double>();
public CustomFilter(XyDataSeries<TimeSpan,double> originalDataSeries) : base(originalDataSeries)
{
_originalDataSeries = originalDataSeries;
// Store a reference in the base class to the FilteredDataSeries
FilteredDataSeries = _filteredDataSeries;
// Update the filter
FilterAll();
}
protected override void FilterOnAppend(int index)
{
// Override FilterOnAppend to update just the latest data-point in _filteredDataSeries for a more efficient filter
base.FilterOnAppend(index);
}
protected override void FilterOnInsert(int startIndex, int count)
{
// Override FilterOnInsert to update just the inserted data-point in _filteredDataSeries for a more efficient filter
base.FilterOnInsert(startIndex, count);
}
protected override void FilterOnRemove(int startIndex, int count)
{
// Override FilterOnRemove to update just the removed data-point in _filteredDataSeries for a more efficient filter
base.FilterOnRemove(startIndex, count);
}
protected override void FilterOnUpdate(int index)
{
// Override FilterOnUpdate to update just the updated data-point in _filteredDataSeries for a more efficient filter
base.FilterOnUpdate(index);
}
public override void FilterAll()
{
// When FilterAll is called, recreate the FilteredDataSeries and apply the filtering.
_filteredDataSeries.Clear();
_filteredDataSeries.Append(_originalDataSeries.XValues[0], _originalDataSeries.YValues[0]);
const double beta = 0.2;
// Implementing a simple low pass filter https://kiritchatterjee.wordpress.com/2014/11/10/a-simple-digital-low-pass-filter-in-c/
for (int i = 1; i < _originalDataSeries.Count; i++)
{
TimeSpan xValue = _originalDataSeries.XValues[i];
double yValue = beta * _originalDataSeries.YValues[i] + (1 - beta) * _filteredDataSeries.YValues[i - 1];
_filteredDataSeries.Append(xValue, yValue);
}
}
}
}