WPF Chart - Examples
SciChart WPF ships with hundreds of WPF Chart Examples which you can browse, play with, view the source-code and even export each WPF Chart Example to a stand-alone Visual Studio solution. All of this is possible with the new and improved SciChart WPF Examples Suite, which ships as part of the SciChart WPF SDK.
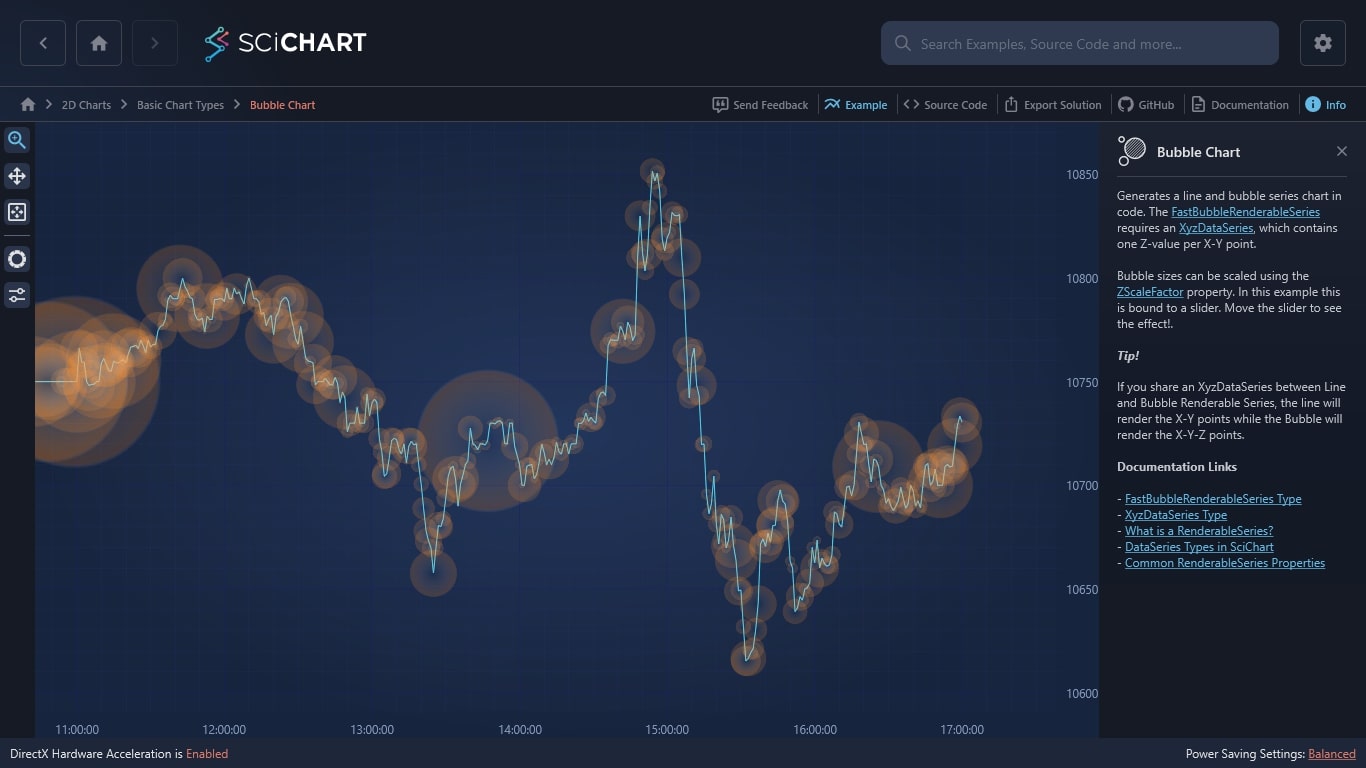
Build a customizable and high-performance WPF Bubble Chart with SciChart’s award-winning WPF Charting Library. Easily generate a line and Bubble Chart with Multiple Series in code, including 3D and Animated Bubble Charts. Our software supports even the most complex real-world applications. It’s possible to display thousands of series, or hundreds of WPF Charts on a single UI without any stalling.
The FastBubbleRenderableSeries requires an XyzDataSeries, which contains one Z-value per X-Y point.
Bubble sizes can be scaled using the ZScaleFactor property. In this example, this is bound to a slider. Move the slider to see the effect!
Start building better WPF web applications with SciChart.
Tip!
If you share an XyzDataSeries between Line and Bubble Renderable Series, the line will render the X-Y points while the Bubble will render the X-Y-Z points.
Documentation Links
– FastBubbleRenderableSeries Type
– XyzDataSeries Type
– What is a RenderableSeries?
– DataSeries Types in SciChart
– Common RenderableSeries Properties
Ready to Build Better WPF Bubble Charts?
The C#/WPF source code for the WPF Bubble Chart example is included below (Scroll down!). You can also view the source code from one of the following sources:
- Clone the SciChart.WPF.Examples from Github.
- Or, view source in the SciChart WPF Examples suite.
- Also the SciChart WPF Trial contains the full source for the examples (link below).
Read our Getting Started guide to complete the following steps:
- Begin your 30-day free trial (No credit card details required)
- Create charts with tutorials
- Compile example source code
- Access documentation
Sign-up to your 30-day free trial of SciChart.WPF. We are the charting software of choice for top enterprise-level businesses, and 98% of our customers would recommend us.
Why Choose SciChart?
Aside from the fact our software can help your developers create the fastest WPF charts, here is a list of other reasons why you should choose us for your big-data WPF Bubble Charts. We’ve been building WPF Charts by developers, for developers since 2012.
- Winner of the Queen’s Award for Innovation
- Fast performance on large data sets
- Expansive features & customizations
- 5-star rated support for developers
- 98% of customers recommend SciChart
- WPF Chart API intuitive & easy to use
Frequently Asked Questions
How easily can the styling be changed on our WPF Bubble Charts?
We understand that you’ll want to be able to change the appearance of your charts to stay on brand and to ensure it looks the part on your web application. SciChart’s WPF Theme Manager supports various themes that allow you to alter the cursor, zoom, axis, grid and series colors. You can even create your own custom theme.
Will my developers be able to access support?
With hundreds of online documentation pages, tutorials, code samples and thousands of forum questions available, you can easily find what you want just by searching online. However, if you’re experiencing an issue that requires support from our team, we’ll be more than happy to help. Did we mention that our support for developers is rated 5-stars?
How does the trial WPF licence work?
With our WPF trial, you will have access to our charting software for 30 days, free of charge. No credit card details are required.

The C#/WPF source code for the WPF Bubble Chart example is included below (Scroll down!).
Did you know you can also view the source code from one of the following sources as well?
- Clone the SciChart.WPF.Examples from Github.
- Or, view source in the SciChart WPF Examples suite.
- Also the SciChart WPF Trial contains the full source for the examples (link below).
BubbleChartExampleView.xaml
View source code<UserControl x:Class="SciChart.Examples.Examples.CreateSimpleChart.BubbleChartExampleView"
xmlns="http://schemas.microsoft.com/winfx/2006/xaml/presentation"
xmlns:x="http://schemas.microsoft.com/winfx/2006/xaml"
xmlns:s="http://schemas.abtsoftware.co.uk/scichart"
xmlns:mc="http://schemas.openxmlformats.org/markup-compatibility/2006"
xmlns:d="http://schemas.microsoft.com/expression/blend/2008"
xmlns:ext="http://schemas.abtsoftware.co.uk/scichart/exampleExternals"
d:DesignHeight="400"
d:DesignWidth="600"
mc:Ignorable="d">
<Grid>
<Grid.ColumnDefinitions>
<ColumnDefinition Width="Auto" />
<ColumnDefinition Width="*" />
</Grid.ColumnDefinitions>
<!-- The SciChartInteractionToolbar adds zoom, pan, zoom extents and rotate functionality -->
<!-- to the chart and is included for example purposes. -->
<!-- If you wish to know how to zoom and pan a chart then do a search for Zoom Pan in the Examples suite! -->
<ext:SciChartInteractionToolbar TargetSurface="{Binding Source={x:Reference Name=sciChart}}" >
<ext:FlyoutMenuButton Style="{StaticResource FlyoutMenuButtonStyle}" Content="BBL">
<ext:FlyoutMenuButton.PopupContent>
<StackPanel Orientation="Vertical">
<TextBlock Text="Slide to change ZScaleFactor" />
<ext:FlyoutSeparator/>
<!-- Create the Z slider -->
<Slider Minimum="0.5" Maximum="5.0" x:Name="zScaleSlider" Value="2.0" Margin="4" Orientation="Horizontal" HorizontalAlignment="Stretch"/>
</StackPanel>
</ext:FlyoutMenuButton.PopupContent>
</ext:FlyoutMenuButton>
</ext:SciChartInteractionToolbar>
<!-- Create the chart surface -->
<s:SciChartSurface Name="sciChart" Grid.Column="1"
Padding="0"
BorderThickness="0">
<!-- Declare RenderableSeries -->
<s:SciChartSurface.RenderableSeries>
<s:FastLineRenderableSeries x:Name="lineSeries" ResamplingMode="MinMax" Stroke="#FFFF3333">
<s:FastLineRenderableSeries.SeriesAnimation>
<s:ScaleAnimation AnimationDelay="0:0:1" Duration="0:0:3" ZeroLine="10650">
<s:ScaleAnimation.EasingFunction>
<ElasticEase EasingMode="EaseOut"></ElasticEase>
</s:ScaleAnimation.EasingFunction>
</s:ScaleAnimation>
</s:FastLineRenderableSeries.SeriesAnimation>
</s:FastLineRenderableSeries>
<s:FastBubbleRenderableSeries x:Name="bubbleSeries" ZScaleFactor="{Binding Source={x:Reference Name=zScaleSlider},
Path=Value, Mode=TwoWay, UpdateSourceTrigger=PropertyChanged}" ResamplingMode="None"
BubbleColor="#77333333" AutoZRange="False">
<s:FastBubbleRenderableSeries.SeriesAnimation>
<s:ScaleAnimation AnimationDelay="0:0:1" Duration="0:0:3" ZeroLine="10650">
<s:ScaleAnimation.EasingFunction>
<ElasticEase EasingMode="EaseOut"></ElasticEase>
</s:ScaleAnimation.EasingFunction>
</s:ScaleAnimation>
</s:FastBubbleRenderableSeries.SeriesAnimation>
</s:FastBubbleRenderableSeries>
</s:SciChartSurface.RenderableSeries>
<!-- Create an X Axis with Growby -->
<s:SciChartSurface.XAxis>
<s:DateTimeAxis GrowBy="0.0, 0.1" DrawMajorBands="True" />
</s:SciChartSurface.XAxis>
<!-- Create a Y Axis with Growby -->
<s:SciChartSurface.YAxis>
<s:NumericAxis GrowBy="0.1, 0.1" DrawMajorBands="True" />
</s:SciChartSurface.YAxis>
<s:SciChartSurface.ChartModifier>
<s:ModifierGroup>
<s:RubberBandXyZoomModifier ExecuteOn="MouseLeftButton" />
<s:ZoomExtentsModifier ExecuteOn="MouseDoubleClick" />
</s:ModifierGroup>
</s:SciChartSurface.ChartModifier>
</s:SciChartSurface>
</Grid>
</UserControl>
BubbleChartExampleView.xaml.cs
View source code// *************************************************************************************
// SCICHART® Copyright SciChart Ltd. 2011-2022. All rights reserved.
//
// Web: http://www.scichart.com
// Support: support@scichart.com
// Sales: sales@scichart.com
//
// BubbleChartExampleView.xaml.cs is part of the SCICHART® Examples. Permission is hereby granted
// to modify, create derivative works, distribute and publish any part of this source
// code whether for commercial, private or personal use.
//
// The SCICHART® examples are distributed in the hope that they will be useful, but
// without any warranty. It is provided "AS IS" without warranty of any kind, either
// expressed or implied.
// *************************************************************************************
using System;
using System.Linq;
using System.Windows;
using System.Windows.Controls;
using System.Windows.Media.Animation;
using SciChart.Charting.Model.DataSeries;
using SciChart.Charting.Visuals.RenderableSeries.Animations;
using SciChart.Examples.ExternalDependencies.Data;
namespace SciChart.Examples.Examples.CreateSimpleChart
{
/// <summary>
/// Interaction logic for BubbleChartExampleView.xaml
/// </summary>
public partial class BubbleChartExampleView : UserControl
{
public BubbleChartExampleView()
{
InitializeComponent();
sciChart.Loaded += OnSciChartLoaded;
}
private void OnSciChartLoaded(object sender, RoutedEventArgs e)
{
// Add a data series to contain Xyy data. We want to use X,Y = position and Y1 = trade size
var dataSeries = new XyzDataSeries<DateTime, double, double>();
// Load the TradeTicks.csv file
var tradeDataSource = DataManager.Instance.GetTradeticks().ToArray();
// Append data to series. SciChart automatically redraws
dataSeries.Append(tradeDataSource.Select(x => x.TradeDate),
tradeDataSource.Select(x => x.TradePrice),
tradeDataSource.Select(x => x.TradeSize));
// XyzDataSeries is shared across two RenderableSeries
// - FastLineRenderableSeries chooses X,Y value to draw
// - FastBubbleRenderableSeries chooses X,Y value for position, Z for size
lineSeries.DataSeries = dataSeries as IXyzDataSeries;
bubbleSeries.DataSeries = dataSeries;
sciChart.ZoomExtents();
}
}
}
