
The Bubble Charts Type
Bubble Charts are provided by the FastBubbleRenderableSeries type. This accepts data from a XyzDataSeries (X,Y, Z=Bubble Scale) and renders a bubble at each XY value.
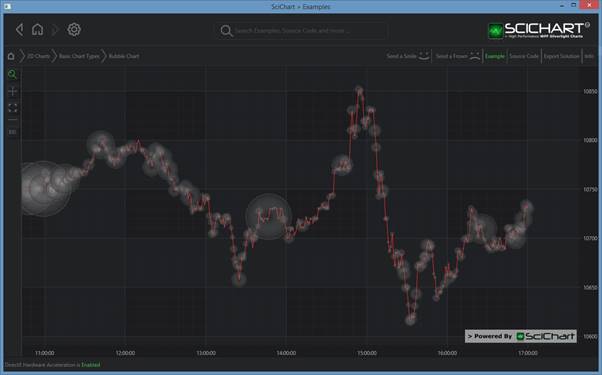
Examples for the Bubble Chart can be found in the SciChart WPF Examples Suite which can be downloaded from the SciChart Website or our SciChart.WPF.Examples Github Repository.
NOTE: For info about XyzDataSeries, as well as other DataSeries types in SciChart, see DataSeries API
Declare a FastBubbleRenderableSeries in Xaml / Code Behind
| Declare a FastBubbleRenderableSeries |
Copy Code |
|---|---|
<!-- where xmlns:s="http://schemas.abtsoftware.co.uk/scichart" --> <s:SciChartSurface> <s:SciChartSurface.RenderableSeries> <s:FastBubbleRenderableSeries x:Name="bubbleSeries" ZScaleFactor="1.0" BubbleColor="#77333333" AutoZRange="False" /> </s:SciChartSurface.RenderableSeries> <!-- XAxis, YAxis omitted for brevity --> </s:SciChartSurface> // Code Behind, e.g. in OnLoaded event handler, set the DataSeries var xyzDataSeries = new XyzDataSeries<double, double>(); // FastBubbleRenderableSeries expects data in the format X,Y,Z xyzDataSeries.Append(1, 1, 1.5); xyzDataSeries.Append(2, 0.5, 0.7); xyzDataSeries.Append(0, 0, 0.5); xyzDataSeries.Append(3, 0.7, 0.6); rSeries.DataSeries = xyzDataSeries; | |
Declare a FastBubbleRenderableSeries in Pure Code
| Declare a FastBubbleRenderableSeries |
Copy Code |
|---|---|
// Declare the scichartsurface var sciChartSurface = new SciChartSurface(); // ... // Declare and add a Error Bars Series var errorBarsSeries = new FastBubbleRenderableSeries() { BubbleColor = Colors.GreenYellow, AntiAliasing = true, AutoZRange = false, ZScaleFactor = 1.0, StrokeThickness = 1, }; // Set some data var xyzDataSeries = new XyzDataSeries<double, double>(); // FastBubbleRenderableSeries expects data in the format X,Y,Z xyzDataSeries.Append(1, 1, 1.5); xyzDataSeries.Append(2, 0.5, 0.7); xyzDataSeries.Append(0, 0, 0.5); xyzDataSeries.Append(3, 0.7, 0.6); rSeries.DataSeries = xyzDataSeries; | |
NOTE: You can also declare RenderableSeries using full MVVM (series ViewModels). Please see MVVM DataSeries / RenderableSeries API for more details.
See Also