Why Your Chart Library Is the Bottleneck You Never Suspected
You’ve spent weeks building a real-time dashboard. The backend is fast. The data pipeline is solid. Your websocket is humming […]
Performance has always been one of the main aims of SciChart’s WPF chart libraries. Our customers include engineering, financial and medical companies who demand the very best performance, flexibility, reliability, integrity of our staff as well as excellent customer service.
We’re proud to announce that SciChart WPF is used by not one, but directly by five Formula One teams! As well as indirect usage in all F1 teams via vendor software in some shape or form.
Defence companies and even governments that demand reliability of our software and integrity of our engineers are repeat customers of SciChart. Medical companies who create cutting edge medical-devices, participate in bleeding edge cancer research use SciChart. They all require high performance.

Having the Fastest WPF Charts is a great selling point but it’s not the only reason to use our Software.
You can find more reasons at Why SciChart: The Best WPF Charts.
Nevertheless, WPF Chart Performance matters to our customers, so we test exhaustively to ensure that SciChart WPF has the best possible performance your demanding applications.
So how do we do that?
We’ve previously talked about SciChart WPF being the Best WPF Chart, and the Fastest WPF Chart control. If you haven’t read it, have a look at SciChart WPF v6 ‘Xccelerated Edition’ Up to 100x (10,000%) Faster WPF Charts where we discuss why we focussed on improving performance in 2019/2020, the steps we’ve taken to ensure that every aspect of our pipeline is optimised and some test results vs. competitors.
Using claims such as ‘Best’ or ‘Fastest’ on our website and marketing is bold but they are backed up by solid data! We’ve carried out extensive performance testing in-house. I’m going to share some of the latest test results below.
It’s worth a note that Open Source WPF charts and almost all Commercial WPF Charts don’t come close to SciChart’s performance. As a result they cannot even register on our demanding test suite. So instead, we’ve compared the latest test results vs. our strongest competitor in terms of performance.
We’ve constructed a WPF Chart Performance Test Suite with over 70 test high-stress test cases covering a wide variety of conditions to assess performance between SciChart & ‘Competitor A’.
Test cases are varied and include:
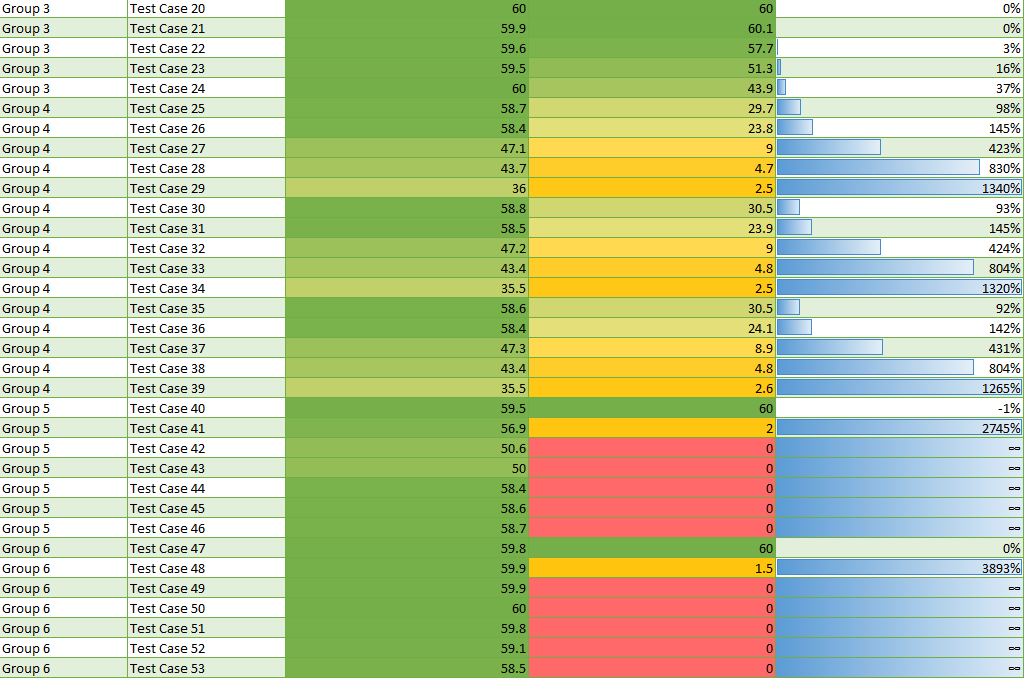
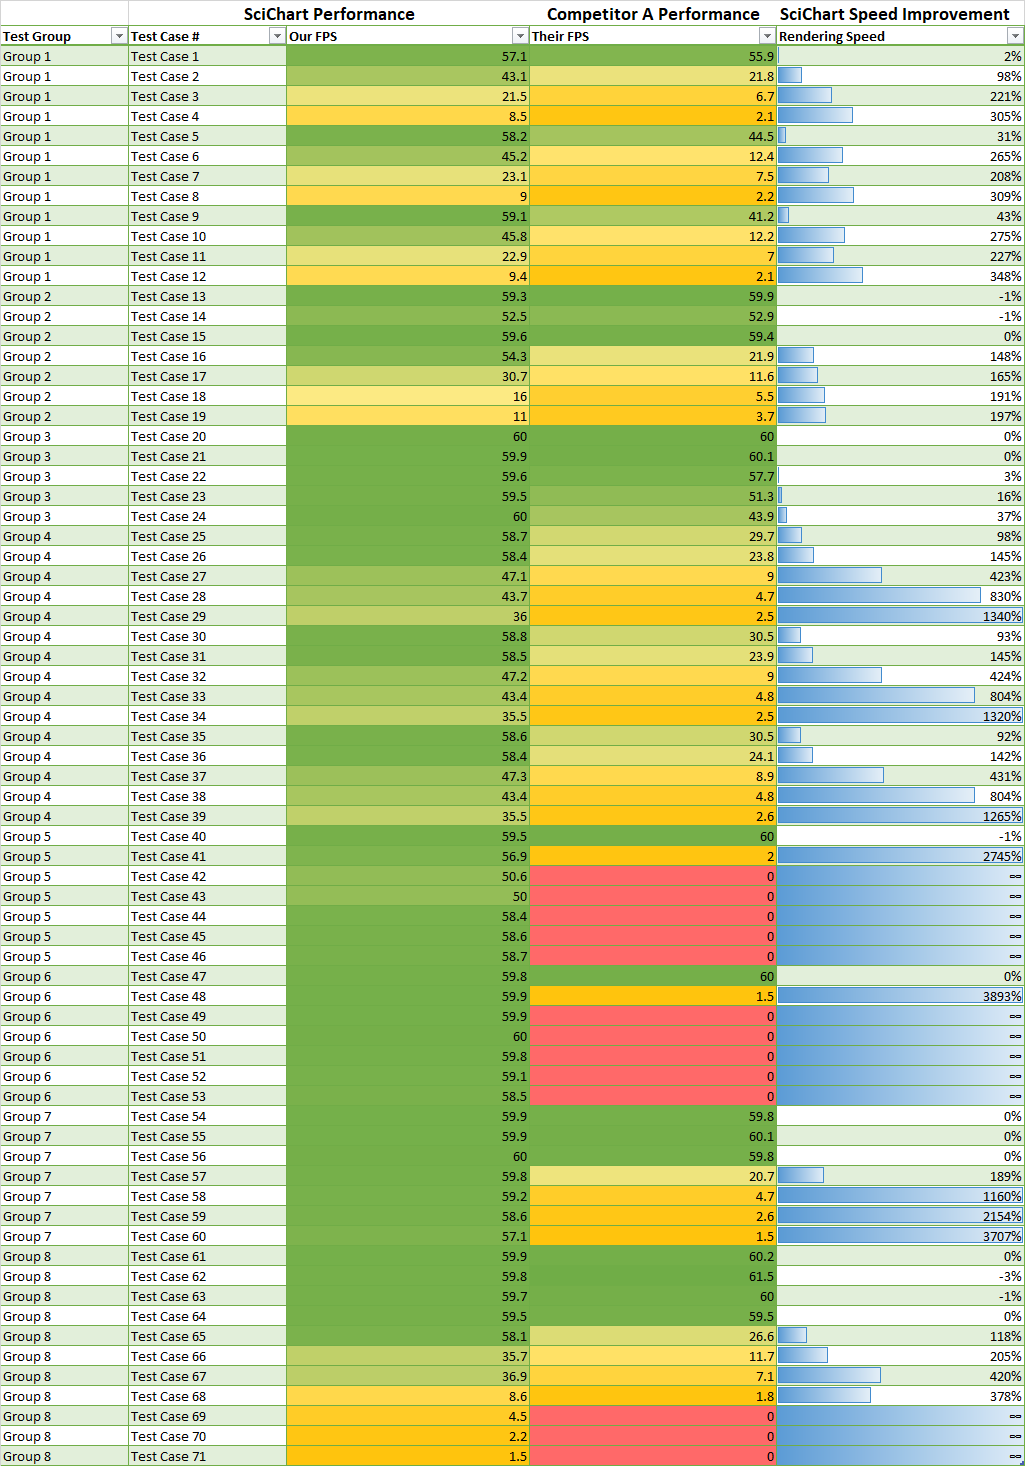
Here are the test results below:
Note: Why have we hidden the test case names? Because in-depth expert analysis of chart performance is valuable and we don’t want to tip our competitors off!
On the Green/Yellow/Red column you can see FPS. This stands for ‘Frames per Second’ and is a measure of how many times the chart draws per second. This number is averaged out over the window for each test.
Meanwhile …
Over 70 demanding WPF Chart Performance test cases, SciChart outperformed the strongest competitor on the market by an average (mean) of 455% faster rendering. A max of 3,893% faster rendering and a median of 156% faster rendering was observed in like-for-like WPF Chart Performance tests.
Note: Several tests performed by Competitor A have FPS=0. This means that a prior test scored low, hanged or crashed and the test was halted for this test group. In this case the SciChart performance increase was effectively infinite, so how can we calculate speed improvement?
What we can do is multiply FPS x Number of data-points in the group to determine a speed score or ‘Datapoints per second’. Then, calculate a maximum speed increase based on which chart was able to render or draw the highest number of data-points.
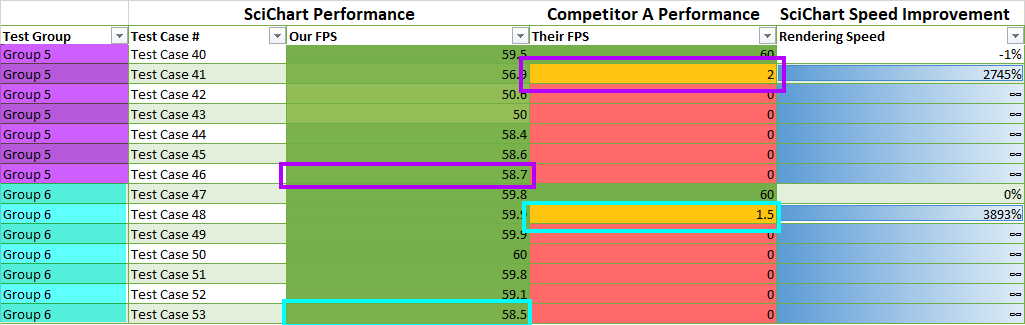
Each Test group was a specific WPF Chart test case. In Test Group 5, Competitor A struggled to draw 1,000,000 (1 Million) data-points at 2 FPS for this test case while SciChart was able to draw 10,000,000 (10 Million) datapoints at 58.7 FPS.
Thus the Data-point per second calculation is:
Test Group 6 was another WPF Chart Type. Competitor A struggled to draw only 10,000 data-points at 1.5 FPS while SciChart was able to draw 10,000,000 (10 Million) datapoints at 58.5 FPS.
So there you have it.
In Demanding WPF Chart Performance tests, SciChart 🥇 was able to outperform ‘Competitor A’ (the 2nd fastest WPF Chart 🥈) by rendering 39,000x more data-points per second in one test case and 293.5x more data-points per second in another test case, by using the Datapoints Per Second methodology above.
CPU usage is also important to our users. What if the chart is the fastest but uses all the CPU resources, making the rest of your application slow?
SciChart is strictly single threaded for rendering, and while we allow you to append data from a background thread (SciChart WPF is thread safe: we handle the locking & synchronisation), there’s very little parallel processing inside SciChart itself. Instead we favour fastest single-threaded path for code, using low-level optimisations as part of our Visual Xccelerator® Engine typically only found in the gaming industry.
Memory in a C# .NET application is also very important. What we found in our testing was that SciChart used considerably less memory than Competitor A to achieve it’s record high performance, meaning there is more memory available for the rest of your application.
At SciChart we’ve optimised not only rendering performance (being fully GPU accelerated), CPU usage (using low-level gaming industry optimization techniques) but also memory making us suitable for the most demanding applications.
At SciChart we are experts in our field. I personally hold a Masters Degree (MEng) and PhD in Electronics, covering the topics of electronic hardware design, embedded systems and signal processing. You can see this post on Linked In here with some of the work I’ve done in this field.
I’ve designed pieces of low-cost electronic measurement hardware which outperformed much more expensive scientific instruments in terms of accuracy. I’ve written algorithms for Fast Fourier Transform on GPUs before the days of nVidia Cuda or OpenCL, have coded several algorithms and hand-tuned the performance of critical sections of C++ & C# code. My team and I understand at a very low level what’s happening on-chip when you process data or perform certain operations in software.
At SciChart we are a team of low-level software optimisation experts. Our experience spans not just C# .NET and WPF, but also Graphics, GPU acceleration, languages such as C++, Swift, Kotlin, Typescript, multiple 3d libraries such as DirectX, OpenGL/OpenGLES, WebGL, Metal and low level performance optimization techniques used in the gaming industry.
We’ve transferred that knowledge into SciChart to bring you an incredibly complex piece of software which looks simple on the surface: SciChart WPF – The Best (and Fastest) WPF Chart. All in a package which is easy to use and ‘just works’ out of the box.
If you do find a use-case where SciChart performs less than optimal, then do contact us. We often have customers reach out with performance issues but it turns out a small tweak in the usage of the library can result in huge performance improvements.
We’ve also carried out bespoke consultancy work for customers in the F1 sector and Financial services to performance tune their apps. Integrating SciChart to a large or complex app requires sometimes the knowledge from our engineers to get the best possible performance out of the library.
Contact SciChart for Performance needs, or Consultancy & Customisation!
Follow Dr. Andrew Burnett-Thompson on LinkedIn or SciChart for more.
Recent Blogs
![]()
Queens Award for Innovation
Proud winners of the Queens Award for Innovation, 2019. Awarded on account of our innovative graphics engine which underpins the SciChart library and enables our world-beating charting performance
![]()
National Business Awards
Highly Commended for Lloyds National Business Awards, 2019. Awarded on account of our innovative graphics engine and impressive customer base
![]()
National Technology Awards
Awarded “Healthcare Tech of the Year” at the 2025 National Technology Awards – a top UK recognition for breakthrough innovation in technology.

Reviews
SciChart has received hundreds of verified, 3rd party reviews