DirectX Compatibility in WPF Charts with SciChart
SciChart now features an optional DirectX10 based renderer. This is currently included as an add-on to the SciChart High Performance […]
Article originally written in November 2019, Updated in November 2021
Back in November 2019, we wrote about the new cutting-edge overhaul to our High Performance Real-time WPF Chart component, which we’re calling ‘SciChart WPF: Xccelerated Edition’. SciChart SDK v6 was released bringing you performance increases of up to 100x (10,000%) across WPF Chart types, allowing you to create the most demanding scientific, financial and big-data enterprise applications, all without changing or sacrificing our powerful & flexible XAML-friendly, MVVM ready WPF chart API.
Today we review these performance tests. How has SciChart improved over the years? Are there are competitors which are faster? Are we still confident our charts are the fastest possible for your applications? Finally what are the latest innovations.
Read on to find out about WPF Chart Performance, and how SciChart leads the field among competitors to this day.
Our charts already provided the cutting edge in data visualisation, providing high performance for real-time and big-data projects, and are used by market leaders in scientific & financial sectors to deliver unbelievable results.
However, our top feature request by our customers prior to 2018/19 was to push the boundaries and limitations of WPF Chart performance even further. We are a customer driven development firm, and we take our direction from the features requested by our user base. Below you can see a screenshot of the SciChart Feature Request system showing performance enhancements as the most hotly requested feature in 2018/2019.

Our customers have demanding projects, innovating globally, with a need to visualise more and more data every year. Our users found when they were using SciChart WPF v5, as the number of data-points they wanted to visualise increased, or when including intensive graphics such as Band charts, Mountain, or Stacked Column charts in their applications, or complex multi-chart dashboards, better performance was needed to handle hundreds of millions, or even billions of points, especially in real-time.
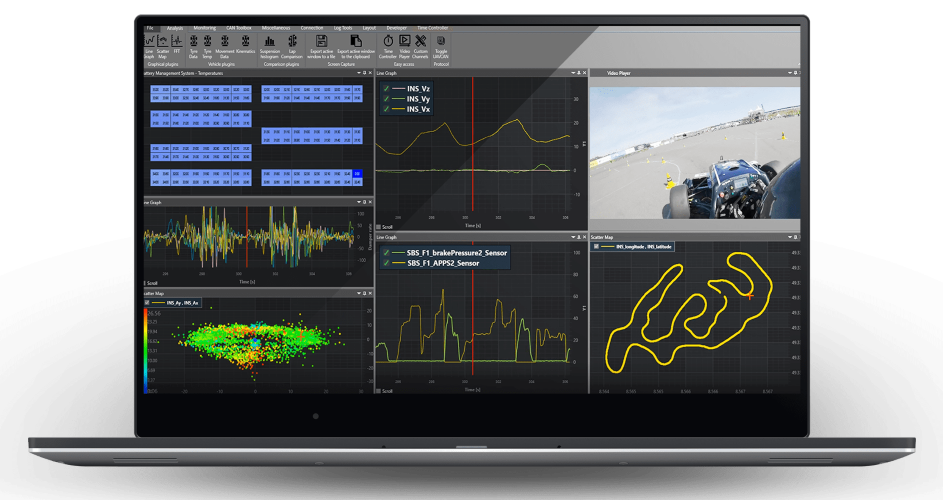
SciChart WPF version 5 was already very fast, exhibiting outstanding performance due to our DirectX rendering pipeline, and optimised data-processing algorithms. However, our clients in sectors such as Aerospace, Engineering, Medical Device manufacturers or even Formula 1 keep pushing the boundary of what is possible by creating dashboards with hundreds, even thousands of series, like this one below (see this F1 and Racing case study).
Knowing what our top clients in Formula 1, Medical Device, Engineering & Aerospace sectors needed to achieve in their project goals, we set about to implement a more optimal solution for complex, real-world scenarios.
Having invested into R&D and recruiting experts around the world, we investigated performance throughout our software and came up with a revolutionary plan to dramatically improve performance across ALL chart types. Our work was completed and we released SciChart WPF version 6 in January 2020!
By this time, SciChart already had a reputation as the Best WPF Chart component, with our extremely flexible, fully featured API and lots of deep customisation. The popular feature request in the previous year of ‘faster performance’ caused us to focus on improving our charting speed even more, bringing cutting edge GPU-accelerated technology to sectors such Finance, Scientific, Medical, Aerospace, F1 & more.
To achieve this, we built a completely new proprietary cross-platform rendering engine, code-named ‘Visual Xccelerator ™’. Our engine fully leverages DirectX/OpenGL/Metal/WebGL and is implemented in C++ for unbelievable performance. A world first. We combined this with a complete re-write of our SciChart WPF internals, having redesigned the component from the ground up, to fully leverage GPU hardware and to scale with future hardware improvements.
SciChart WPF v6 pushed the boundaries of graphics and data visualisation but even with these improvements we remained backward compatible on our existing XAML-based, MVVM-friendly API. With SciChart WPF v6 you know longer have to sacrifice the cleanness of your code by writing code-behind or losing the ability to Xaml-style elements in order to achieve record fast performance. With SciChart you can have both. That’s why we’re rated the best!
Furthermore, to future proof ourselves, our Visual Xccelerator™ engine allows us to fully GPU accelerate our 2D/3D charts on WPF (Windows) but also iOS, Android, MacOSX and even Browser/Web based platforms. We have now completed out our cross-platform vision, we have surpassed many chart components written in JavaScript by orders of magnitude, we have released SciChart.js – High Performance JavaScript Charts – based on the same technology and shared codebase.
The performance enhancements in our v6 of SciChart really are impossible. SciChart WPF Xccelerated Edition is up to 10,240% faster than SciChart v5.x, on average ~5,000% faster, and surpassed all known WPF Chart competitors at the time. Our customers were able to buy with confidence knowing that with SciChart, they will have the world’s fastest WPF Chart at their fingertips, and plot real-time data at warp-speed with our new Visual Xccelerator™ engine.
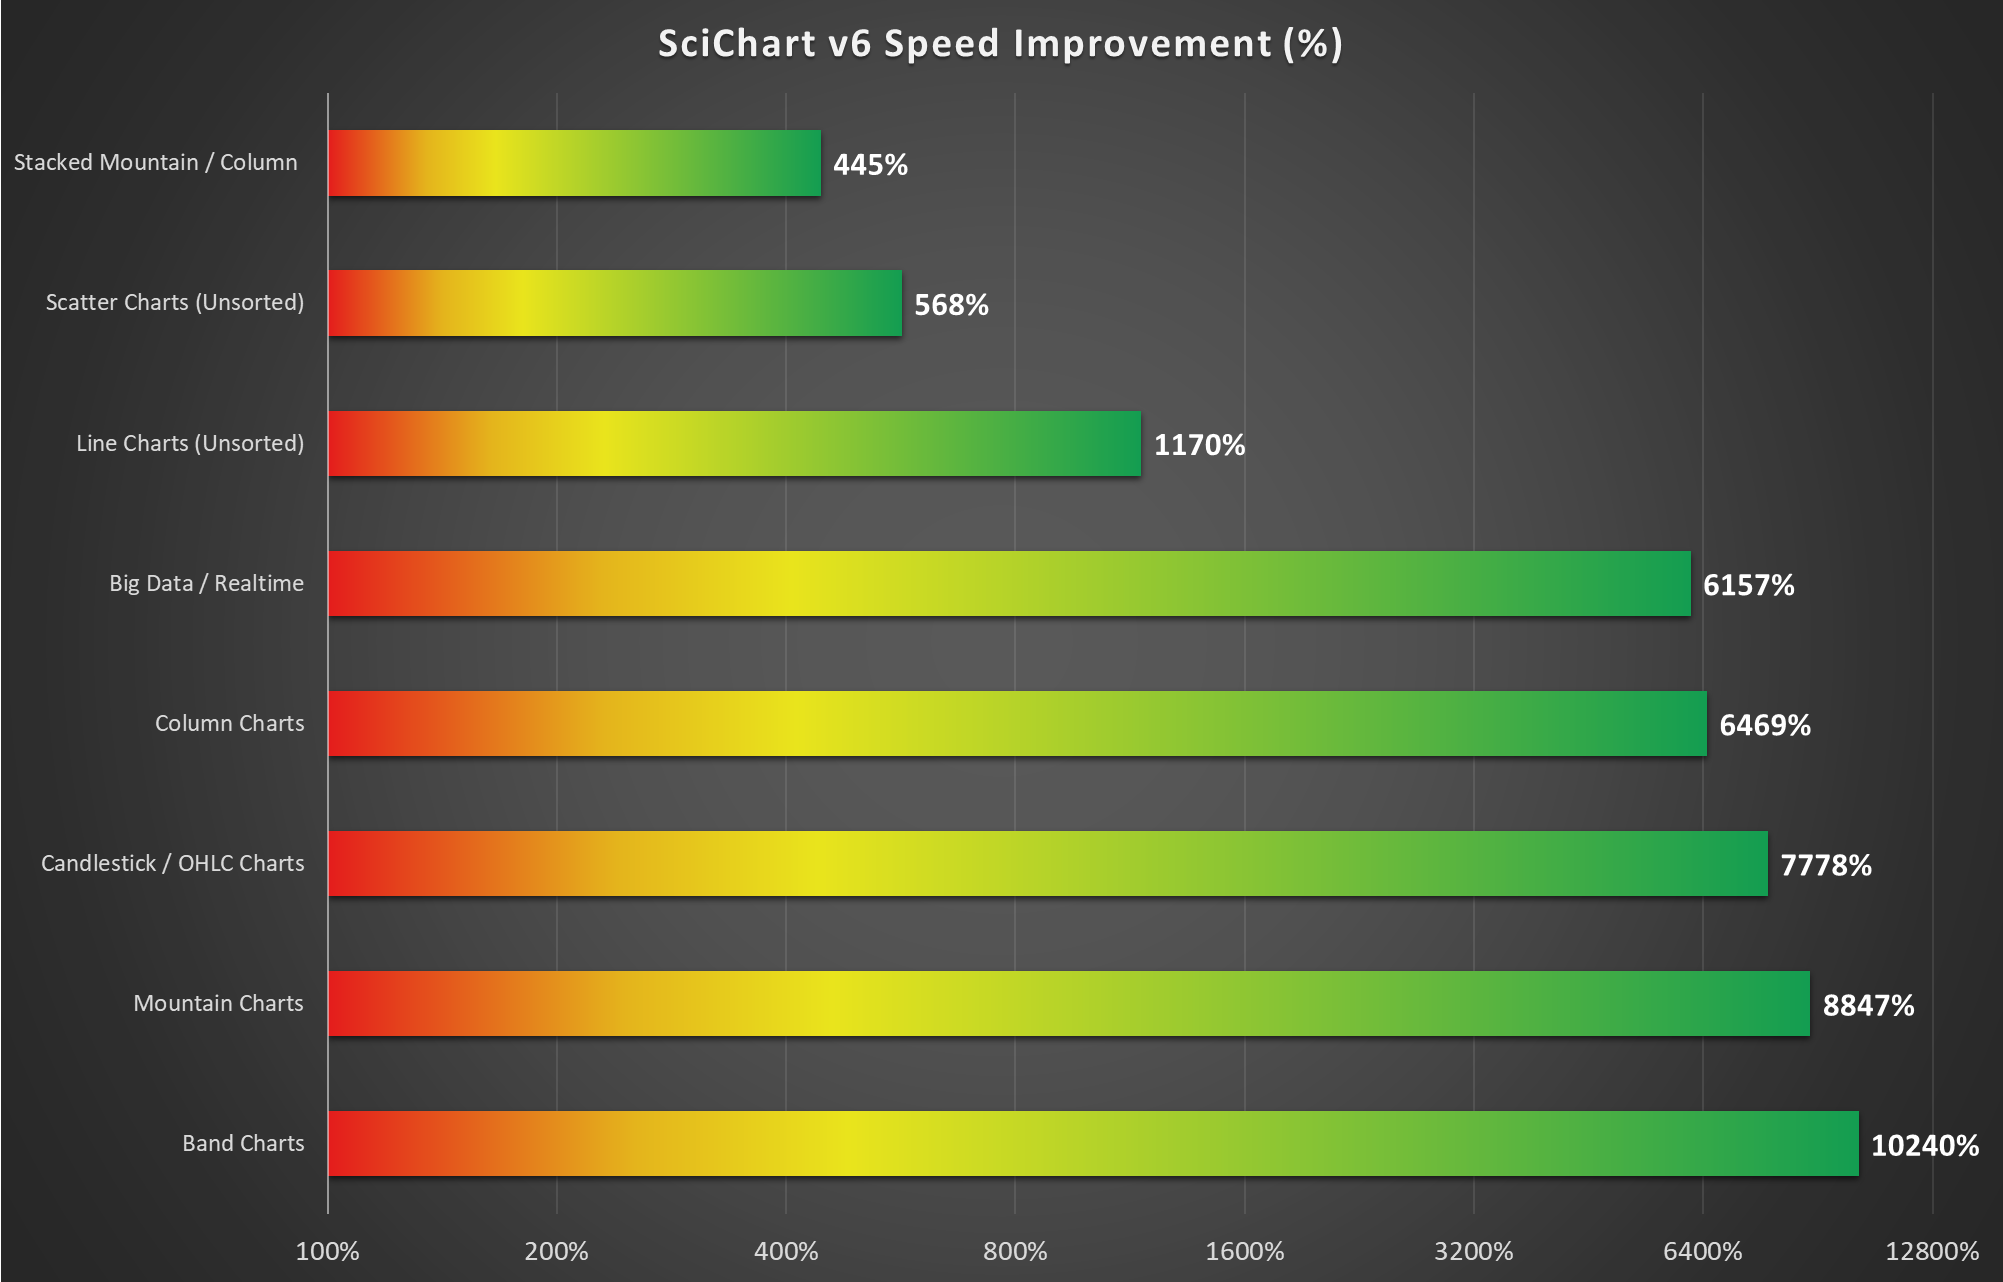
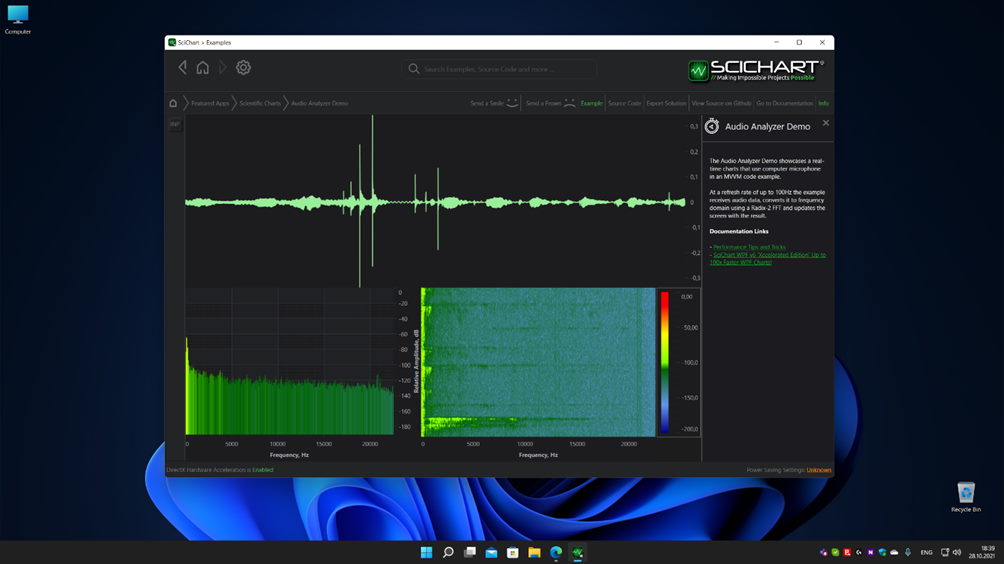
These performance improvements were application wide, not just optimising one or two chart types. With the new engine enabled (see below), our customers saw improvements straightaway to line charts, scatter, band, mountain, area, candlestick, column, as well as real-time big-data charts.
The CPU usage was significantly lower & memory usage has been optimised as well. With SciChart WPF v6, more computing resources were free to perform other intensive tasks, and the UI of your applications are more responsive under even the most demanding conditions.
To test our charts performance internally and measure performance gain as we developed this update, we wrote a complete test-suite to cover all kinds of WPF Chart performance cases.
Charting performance is complex and must be measured in a variety of ways to see an overall improvement. Line series with millions (now tens of billions or even up to 64 Billion) of points is one such test, but what about other tests?
Internally in SciChart, to validate our claims of Fastest WPF Chart Performance we went through extreme lengths to make sure our software is as optimal as possible, and test a wide variety of test cases.
We built a Performance Test Suite internally to check the speed of all our chart types, in static & real-time cases, and to help us diagnose and improve performance throughout SciChart, so we can comprehensively measure, test and demonstrate performance improvements across chart types.
Above: The Performance Test Suite is used internally to check all our chart types, static and real-time cases, to validate performance of SciChart WPF in a wide variety of demanding use-cases.
The SciChart WPF performance test-suite has chosen test-cases which pushed our last version (SciChart WPF v5) to the limit, then shows the massive performance improvements in SciChart WPF v6. It includes a number of complex scenarios, such as:
We’ve taken the time to develop this comprehensive performance test-suite in-house so that we can measure the improvement across a wide variety of demanding conditions, not just optimise one or two cases and declare ourselves ‘the fastest’. We have confidence that the results we present below are both accurate and a truthful representation of our WPF chart performance, as we’ve gone to extreme lengths to measure, test and optimise rendering speed.
We’ve decided not to publish this test suite, as it could be used by competitors to measure and tune their own chart performance, however, we’ve created a YouTube video showcasing it.
The test results are included below.
Test Setup: Intel i7 4.6GHz, 32 GB DDR4 RAM, nVidia GTX 1070 GPU.
Below are test results for basic drawing of several different chart types. We’ve gone further than previous iterations of SciChart by improving everything. Not just faster line series or scatter but also Band series, Mountain, Candlestick, Stacked Column … all chart types have gotten the same treatment to dramatically improve performance.
| Test case | SciChart v5 | SciChart v6 | Performance Increase |
| Line Series 10M Unsorted Data | 2.26 | 31.68 | 1401.77% |
| Scatter Series 10M Unsorted Data | 6.42 | 36.46 | 567.91% |
| Mountain Series 1k x 1k | 0.66 | 58.39 | 8846.97% |
| Band Series 1k x 1k | 0.57 | 58.37 | 10240.35% |
| Column Series 1k x 1k | 0.91 | 58.87 | 6469.23% |
| CandlestickSeries 1k x 1k | 1.4 | 56.62 | 4044.29% |
| OHLC Series 1k x 1k | 0.5 | 57.56 | 11512.00% |
| Stacked Mountain 10 x 10k | 14.23 | 59.89 | 420.87% |
| Stacked Column 10x 10k | 12.78 | 59.9 | 468.70% |
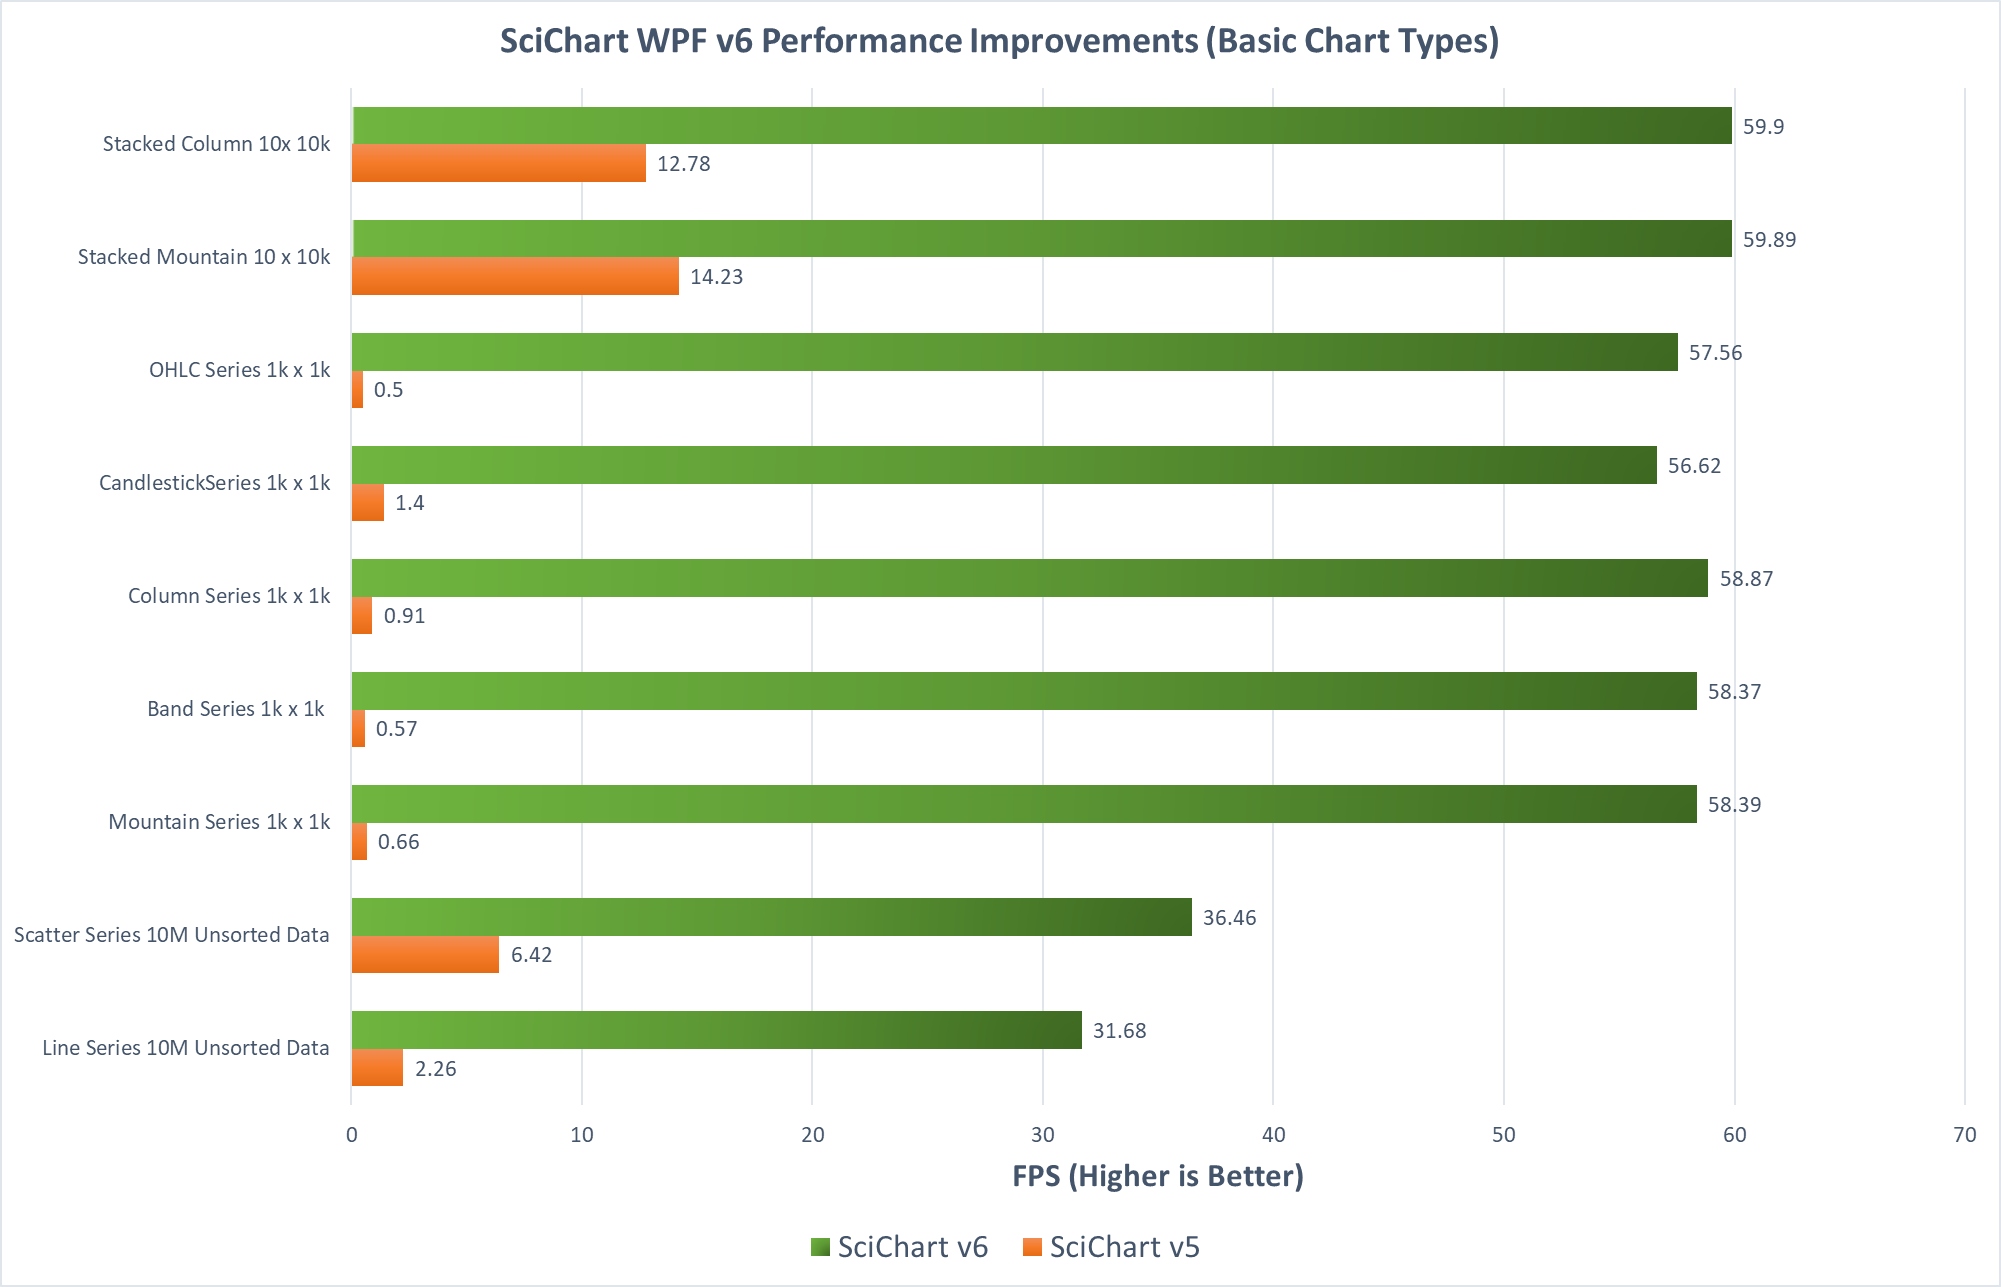
In summary:
Static chart types are tested above, but what about real-time scrolling or streaming charts?
We’ve made multiple algorithmic changes throughout SciChart to how the data is being processed for rendering on screen and to squeeze every last cycle out of the CPU. The results are staggering. SciChart WPF v6 is up to 6,157% faster for drawing realtime charts, and can now render up to 1-billion points at 60 FPS.
| Test case | SciChart v5 | SciChart v6 | Speedup |
| FIFO Series Streaming 10M | 57.9 | 59.69 | 103.09% |
| FIFO Series Streaming 50M | 15.65 | 60.05 | 383.71% |
| FIFO Series Streaming 100M | 8.15 | 60.05 | 736.81% |
| FIFO Series Streaming 500M | 1.69 | 59.16 | 3500.59% |
| FIFO Series Streaming 1 BN | 0.96 | 59.11 | 6157.29% |
| Append 3Million + 10k | 37.87 | 59.63 | 157.46% |
| Append 3Million + 100k | 14.55 | 54.39 | 373.81% |
| Append 30 Million + 10k | 12.5 | 57.03 | 456.24% |
| Append 30 Million + 100k | 6.82 | 51.84 | 760.12% |
The FIFO Tests above show a static number of points scrolling from left to right. For instance, 10 Million, 50 Million, 100 Million, 500 Million or 1 Billion data-points with up to 3,000,000 (3 Million) new data-points added and scrolled to the chart per second, all render at 60 FPS.
The Append Tests start off with a starting number of points (either 3 Million or 30 Million) then append a certain amount as fast as it can to three series. The most challenging test case starts with 30 Million Points and appends 100k to 3 series at 51.84 FPS. A total of over 15 Million new Data-Points per second.
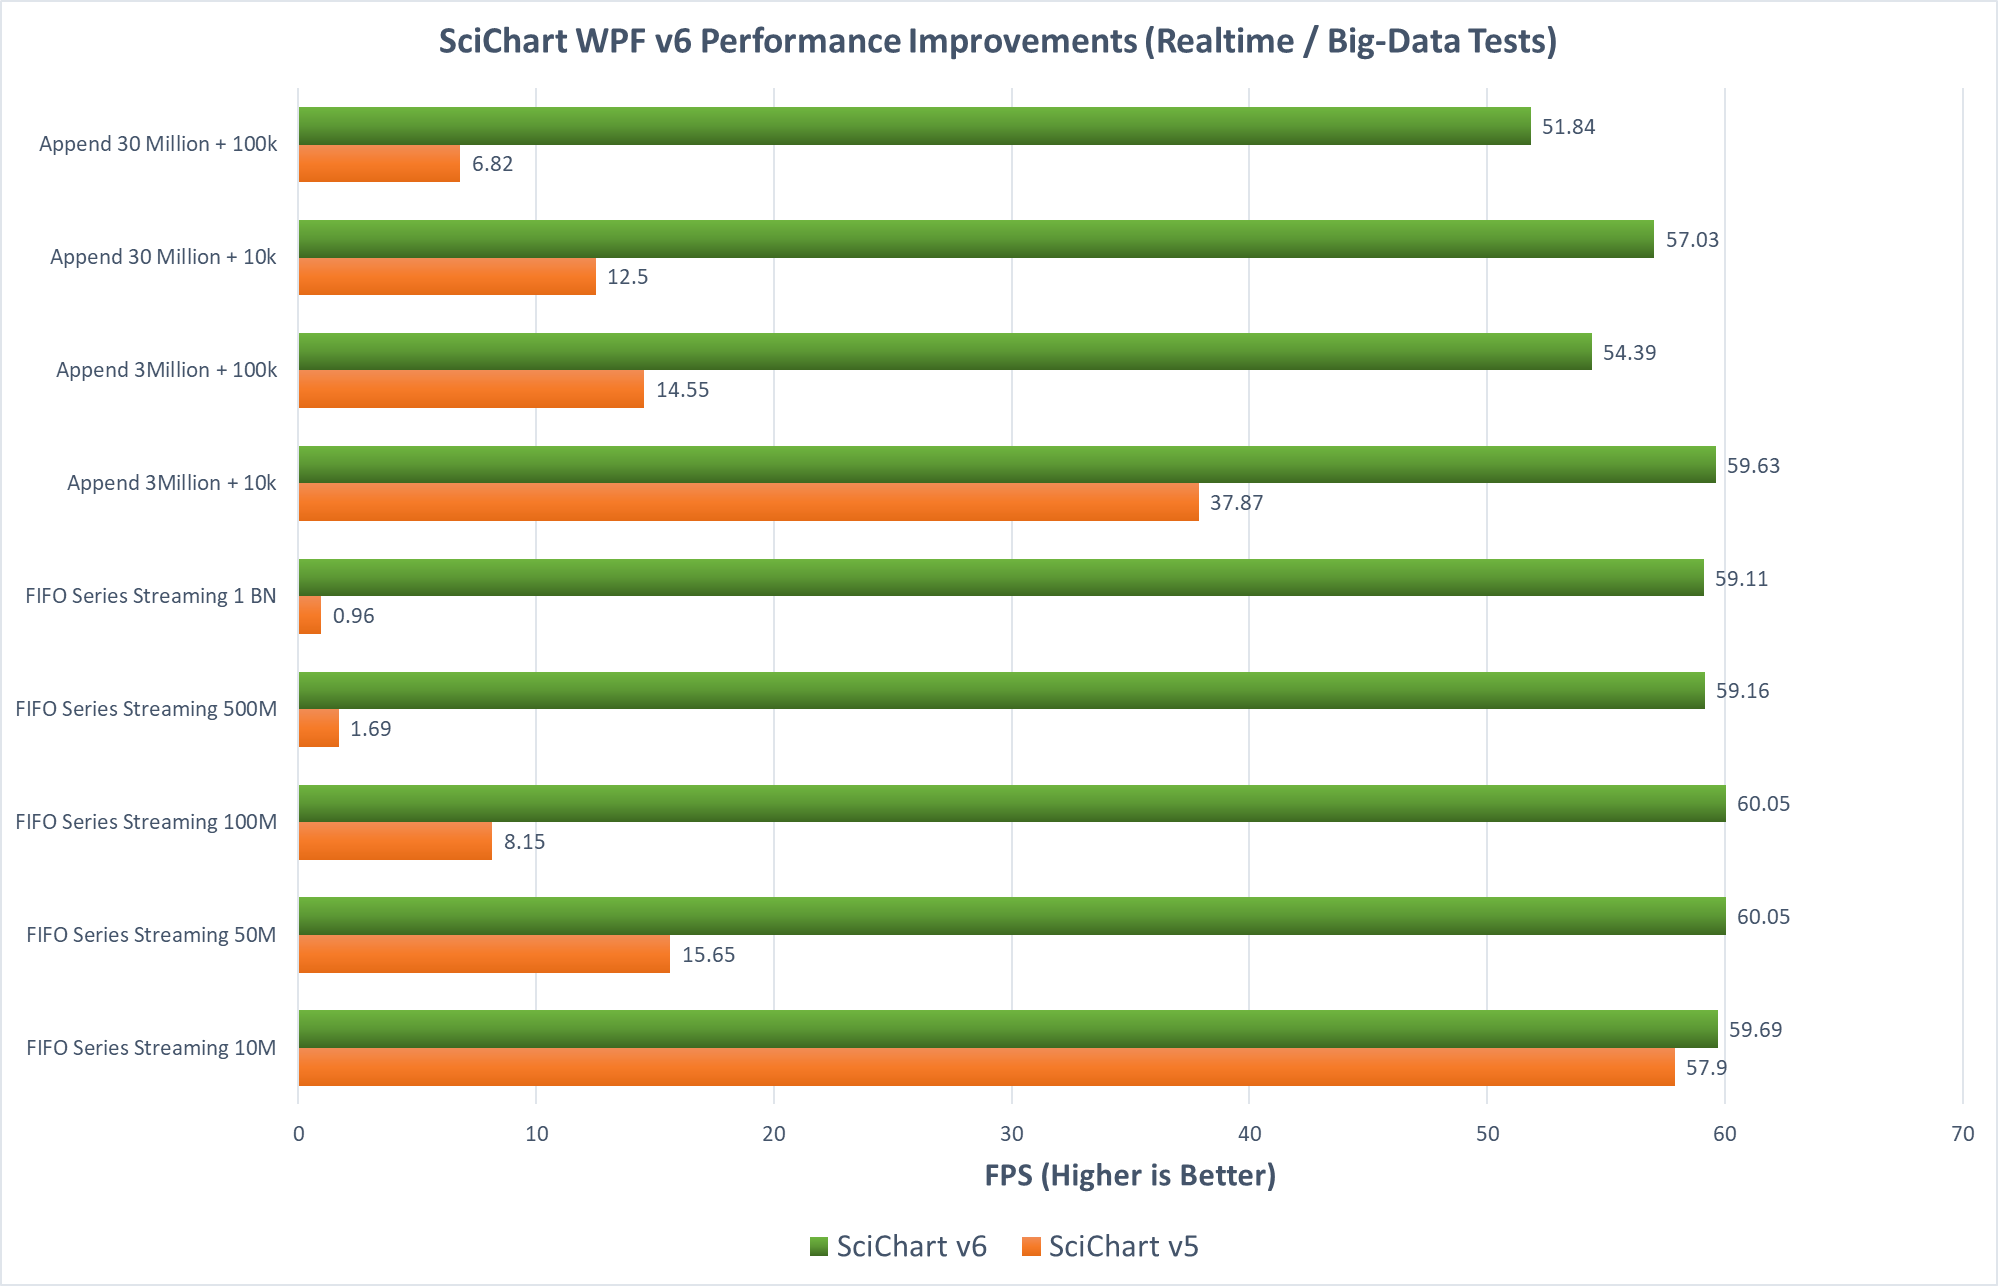
Real-time performance improvements of SciChart WPF v6 are absolutely staggering. Make no mistake, these are the world’s fastest WPF Charts by a considerable margin.
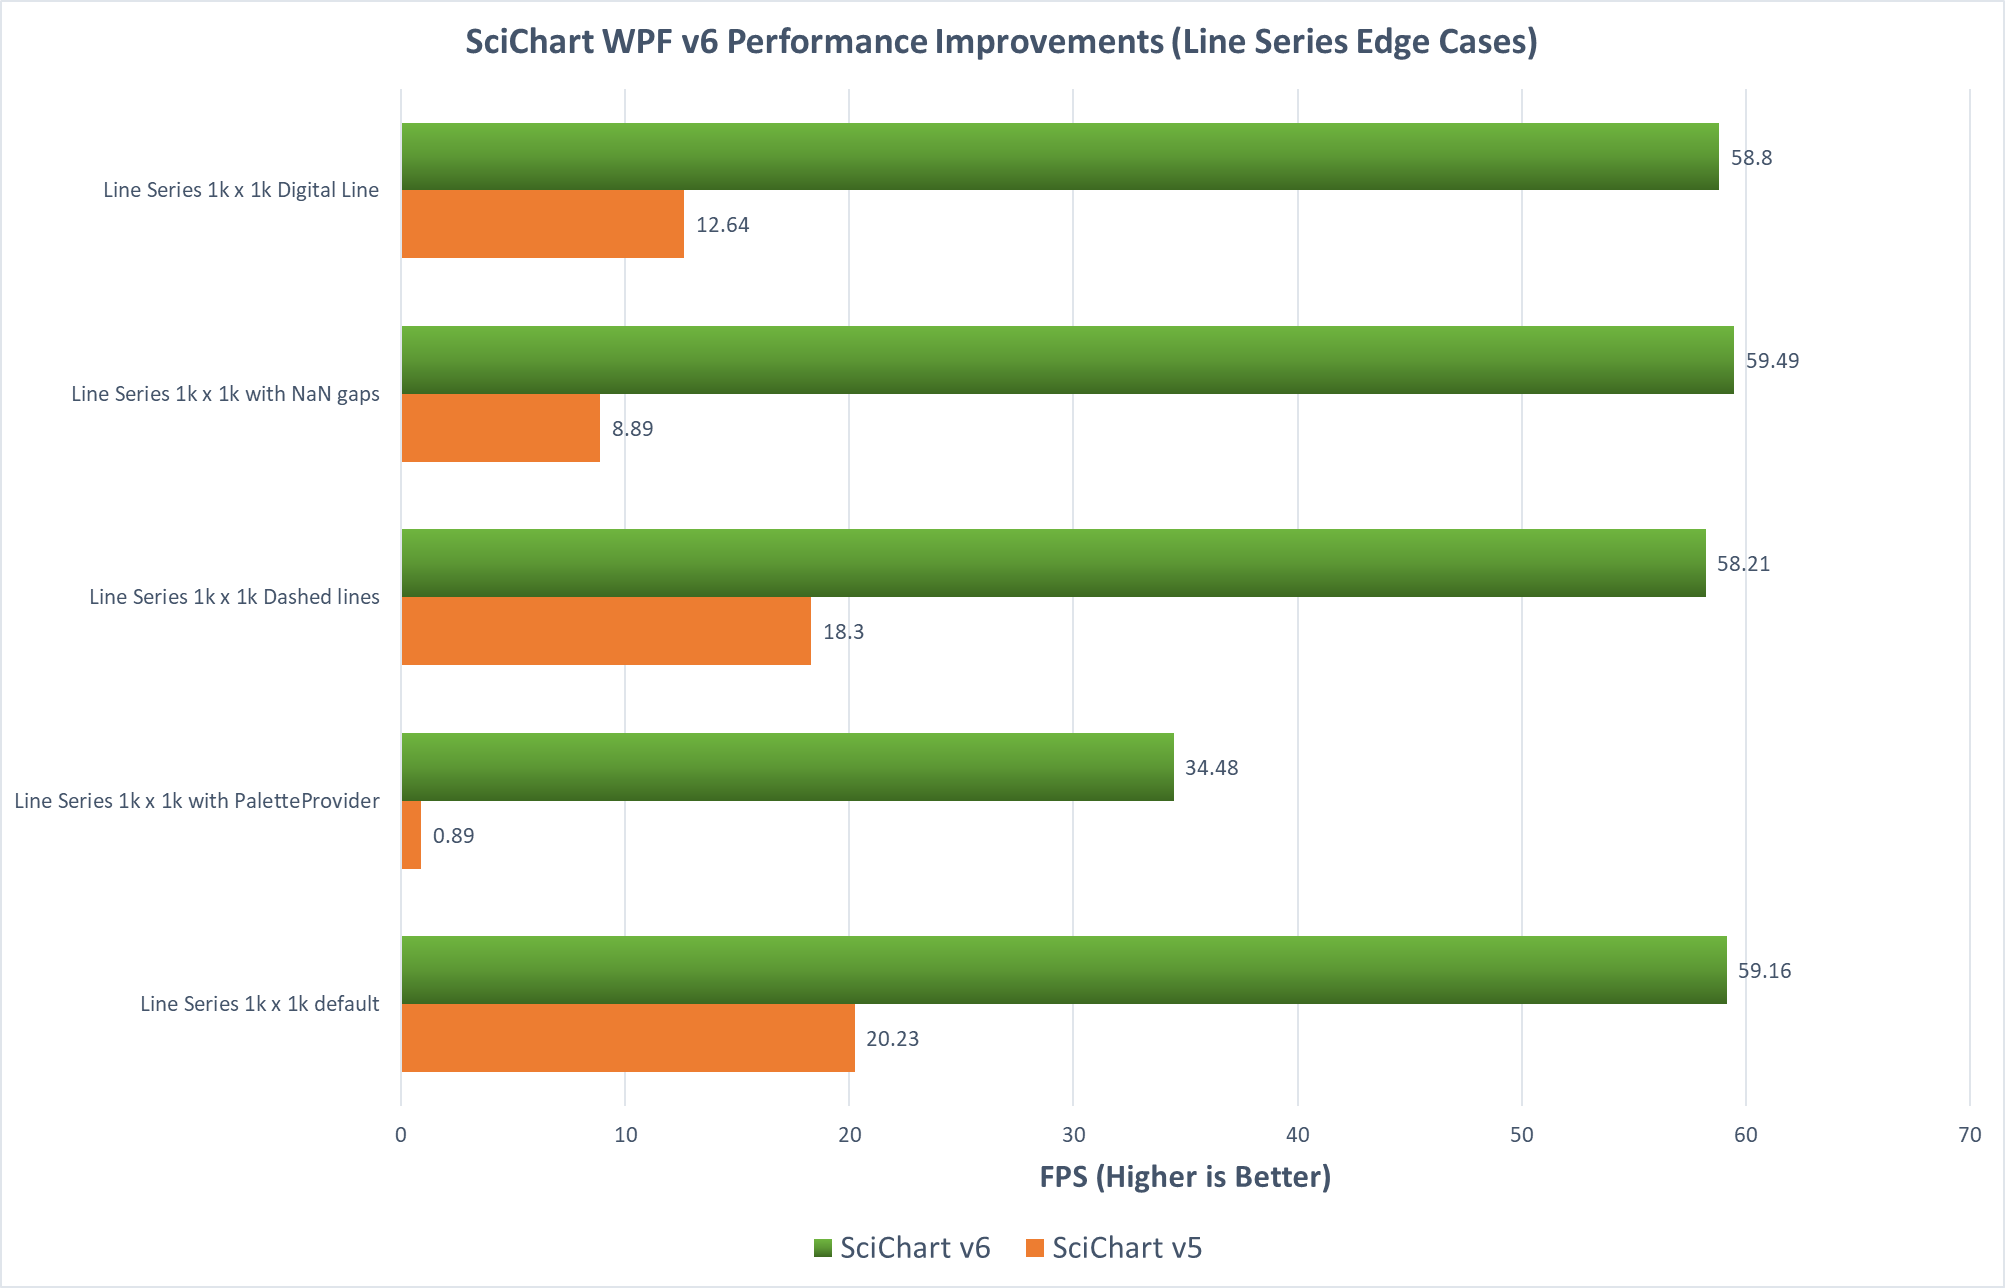
SciChart WPF v5 could draw line charts pretty fast, but if you added in edge-cases such as changing the colour per-point, or including gaps in series with double.NaN, or dashed lines, or digital lines, the extra processing would slow down the chart. In SciChart WPF v6, we have improved all these scenarios. Take a look at the test results below.
| Test case | SciChart v5 | SciChart v6 | Performance Increase |
| Line Series 1k x 1k default | 20.23 | 59.16 | 292.44% |
| Line Series 1k x 1k with PaletteProvider | 0.89 | 34.48 | 3874.16% |
| Line Series 1k x 1k Dashed lines | 18.3 | 58.21 | 318.09% |
| Line Series 1k x 1k with NaN gaps | 8.89 | 59.49 | 669.18% |
| Line Series 1k x 1k Digital Line | 12.64 | 58.8 | 465.19% |
In summary:
These really are our fastest ever WPF charts and the results are astonishing: SciChart WPF v6 is on average 5,000% faster than SciChart v5, and all scenarios perform faster than our previous WPF chart version.
What about competitors? Does SciChart still lead the crowd?
We’ve carried our performance tests vs. competitors in 2019, 2020 and more recently in 2021 so we are confident when we say that SciChart has the Fastest WPF chart, and under what conditions (more on that below).
Let’s see the test results.
Below is a battery of tests between SciChart WPF v6 and one of our strongest competitors in terms of performance. This test was carried out in 2019 when we first released SciChart WPF v6.
When compared against this WPF Chart component in almost all cases, SciChart WPF v6 outperformed ‘Competitor A’. Not only higher FPS (frames per second), but also lower CPU usage and lower memory usage in almost all cases. The number of data-points processed per second is higher with SciChart, and in our tests we can comfortably process up to 15 Million new data-points per second at 50 FPS.
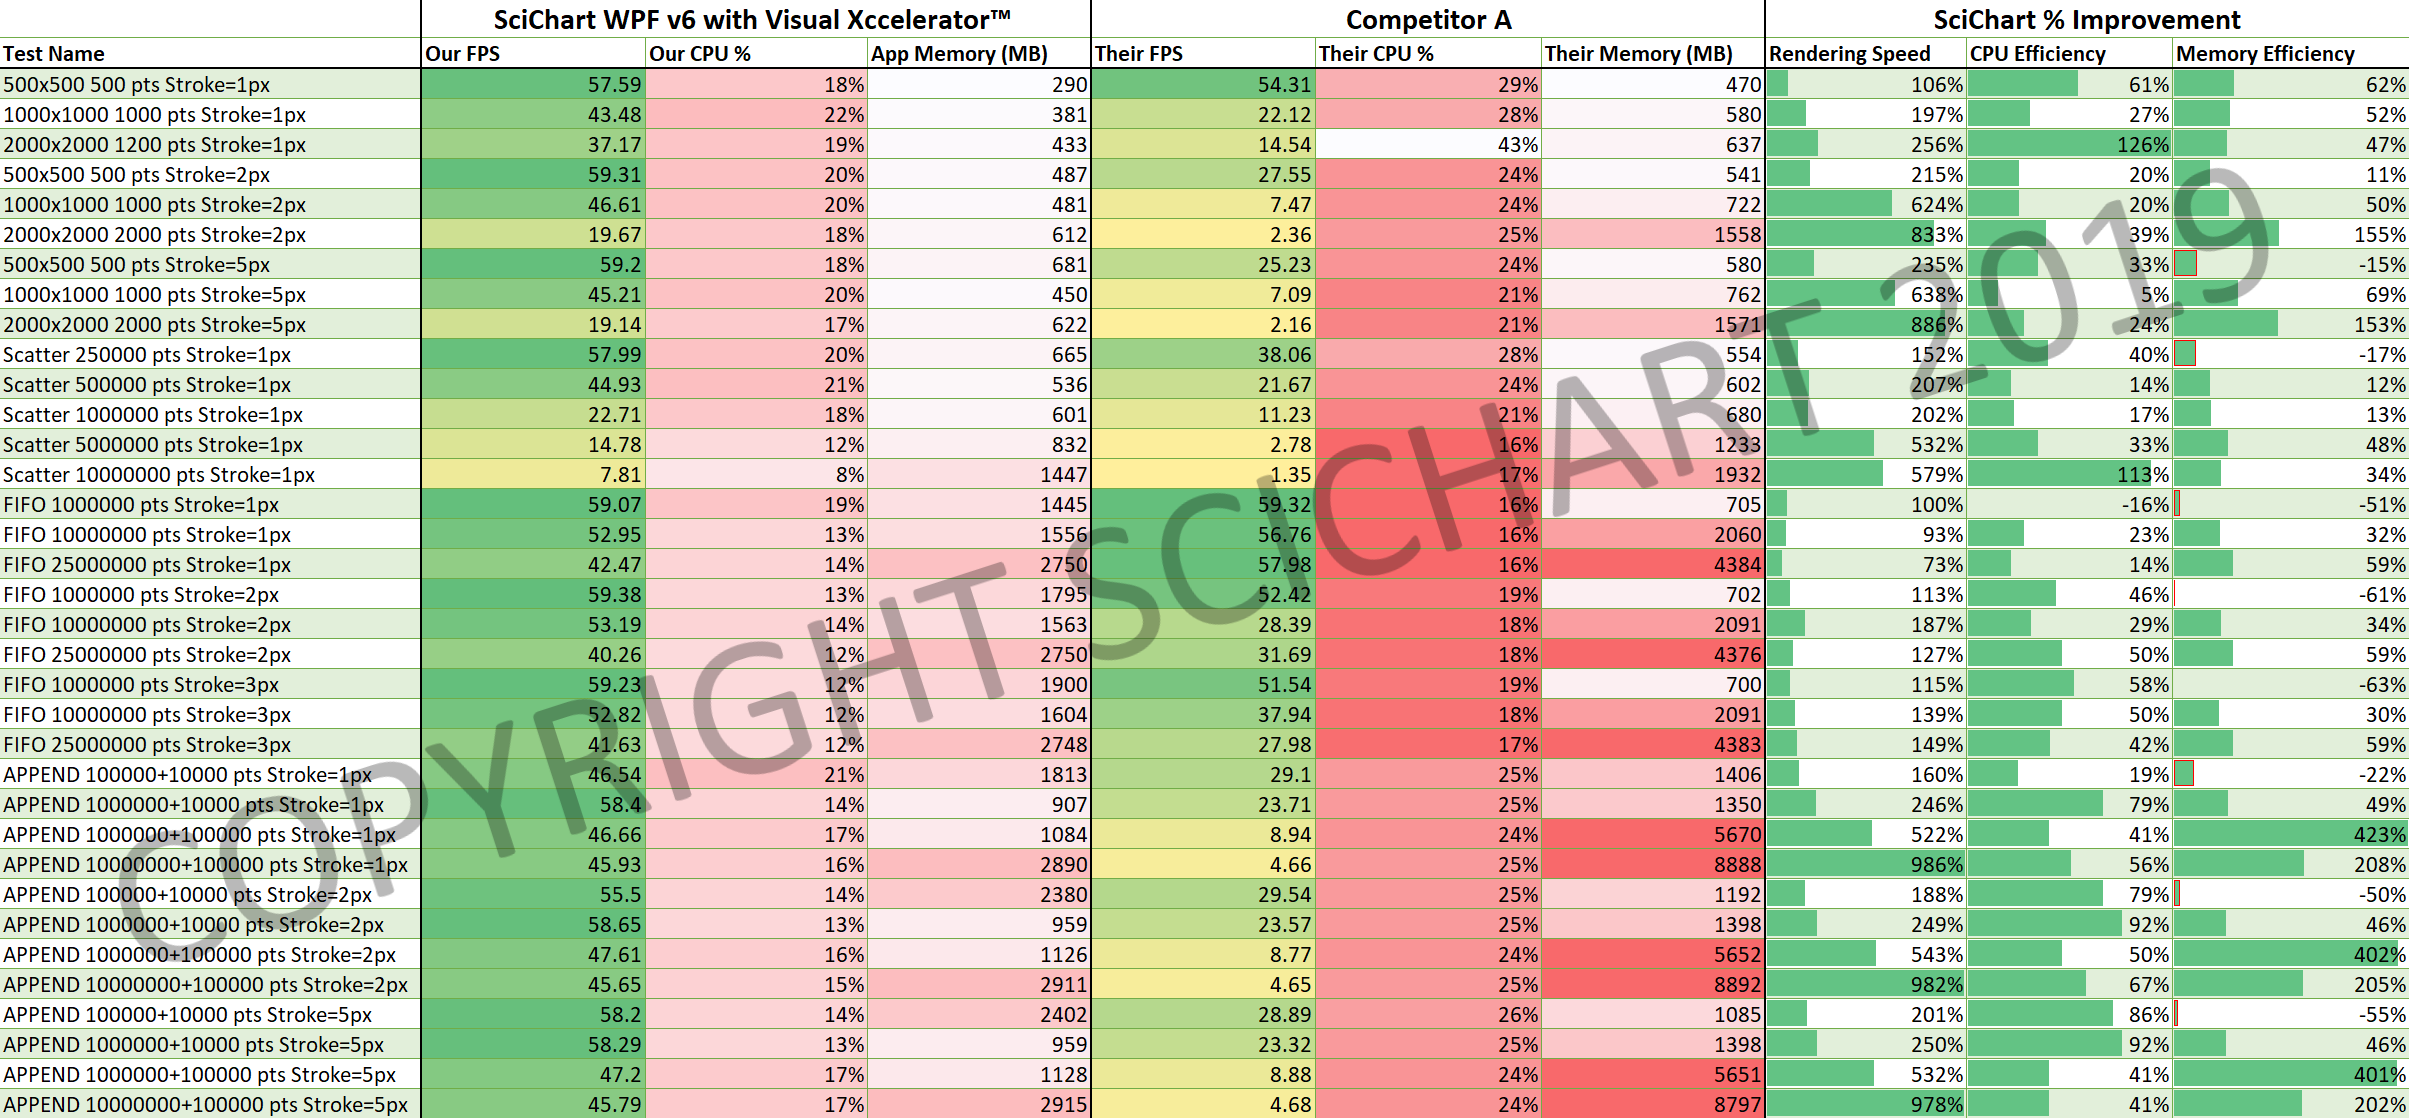
I bet you’re dying to see how these tests have changed since then? Is ‘Competitor A’ faster? The short answer is No. Across an even wider set of real-world test cases, in 2021 SciChart is still outperforming all known competitors. In one specific test case, SciChart WPF v6.5 is on average 455% faster and up to 39,000x faster than the closest known competitor. Read more at the blog post below!
2021 Performance Comparison Results update
We show a WPF Chart Performance Comparison where SciChart renders up to 39,000x faster than the closest competitor, with an average of 455% faster across demanding & varied test cases…
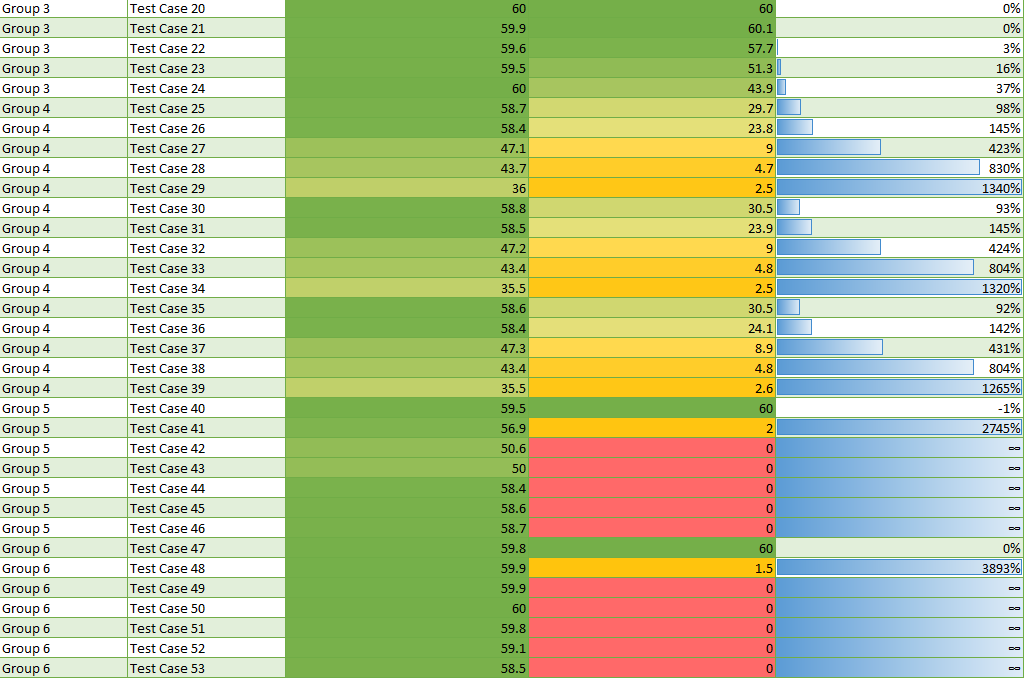
We like to test across a wide variety of real-world conditions. One edge-case is not enough. Our customers are building complex data-visualisation dashboards in WPF and they often find us to be faster. Our customers are also very discerning, carrying out comprehensive performance analysis vs. a number of WPF Chart components in order to determine which one meets their needs.
Across a battery of demanding, real-world and varied tests, SciChart on-average not only outperforms on average all known competitors in terms of refresh rate, but also UI responsiveness, with lower CPU usage and Memory usage, providing you with extremely efficient big-data, real-time data-visualisation.
Most commercial or open-source WPF Chart components really don’t come close to SciChart in terms of performance, and the test cases we carry out are extremely demanding (line charts up to 4,000 series x 4,000 points, charts with over 10 Billion real-time points, scatter charts with 30 Million points). Against almost all competitor charts, SciChart is an order of magnitude faster. In one test case, SciChart is 39,000x faster than the closest known competitor.
We’ve now pushed the boundaries of WPF Chart performance so far, our v6.5 is able to visualise up to 64 Billion datapoints under the following conditions: Time series data, evenly spaced, digital signals. Watch the video below and follow the links in description to verify for yourselves.
Of course, these are very specific conditions. However you can expect from SciChart excellent performance across a wide-range of chart types and use-cases.
In the past, customers have indepdendently rated us the Best & Fastest WPF Chart control after comparing with multiple competitors. Here are a couple of reviews below from customers mentioning performance (see more on Why SciChart? The Best WPF Chart):
We would love to hear from you what you think of SciChart WPF’s performance. Can we improve? Are we already in the lead? Let us know!
If you’re a user of SciChart WPF – do you believe competitor claims to be true? In fact, get in touch if you have compared SciChart’s performance vs. competitors and let us know what you found in real-world conditions.
If we’re not performing fast enough, we want to hear that too. Our team of engineers is great at optimisation and they’ve often helped customers squeeze order of magnitude increases out of their apps with simple adjustments.
You can be assured if you are selecting or evaluating chart components based on performance, that with SciChart WPF v6 ‘Xccelerated Edition’, you will be getting the world’s fastest WPF Chart control in your applications.
Not only that, also a component which is flexible, easy-to-use, rated as best, as well as award winning, and highly commended for innovation. Our Fastest ever charts, offering world-class performance, all in a XAML-friendly, MVVM capable WPF chart library.
You can now download SciChart WPF v6 directly from our downloads page at www.scichart.com/downloads
We are also hosting the packages over at Nuget.org under package name ‘SciChart’
For a quick getting-started guide, including showing how to start a trial and how to run the tutorials, see www.scichart.com/getting-started-scichart-wpf
Thanks to everyone who voted on the feature request for faster performance charts! We never would have done it had we not seen the overwhelming response to accelerate our charts to new levels.
And thanks to our incredibly talented tech team who have taken an already fast WPF chart and pushed it to the absolute limit of what is possible on modern computing hardware!
Best regards,
Andrew
[SciChart Team]
Related Posts
![]()
Queens Award for Innovation
Proud winners of the Queens Award for Innovation, 2019. Awarded on account of our innovative graphics engine which underpins the SciChart library and enables our world-beating charting performance
![]()
National Business Awards
Highly Commended for Lloyds National Business Awards, 2019. Awarded on account of our innovative graphics engine and impressive customer base
![]()
National Technology Awards
Awarded “Healthcare Tech of the Year” at the 2025 National Technology Awards – a top UK recognition for breakthrough innovation in technology.

Reviews
SciChart has received hundreds of verified, 3rd party reviews