SciChart has achieved a great deal in the past year, notably the pace of large releases has really increase in 2020 with the roll out of SciChart WPF v6 – The World’s Fastest WPF Charts in January, SciChart Mobile v3 – a total re-write of our mobile charts with 3D Chart support and SciChart macOS in September and now finally with SciChart.js Ultra Realtime JavaScript Charts v1 in November 2020.
That’s an incredible amount of work for a year which has been challenging to say the least! … A year in which we’ve also achieved substantial economic growth, despite the circumstances.
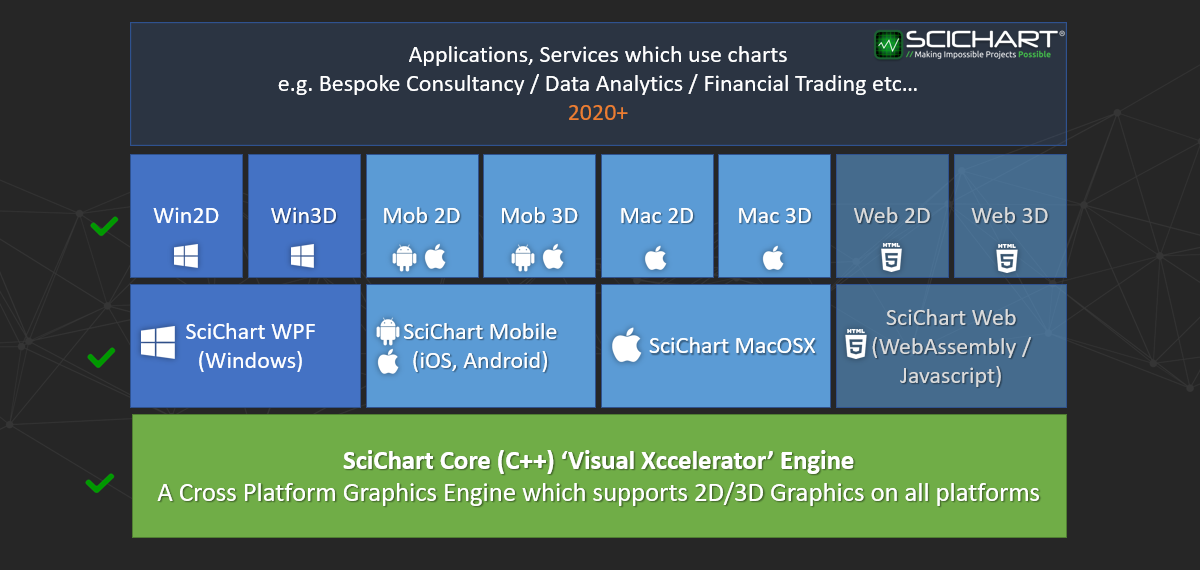
We published originally about our roadmap and vision for SciChart a few years ago, where we talked about how we planned to build a common C++ core across platforms, and build every platform on top of that. That vision is now complete!
All the SciChart platforms: WPF (Windows), iOS/Android (Mobile), Xamarin, macOS and JavaScript share a common core written in C++, an extremely fast, lightweight, 2D/3D graphics engine which we call Visual Xccelerator™. We’ve built this engine to compile to many targets, and use a variety of graphics technologies such as DirectX, OpenGL, Metal and WebGL to run on various platforms.
What this has done is allowed us to re-use code and build for platforms faster:
- SciChart WPF took us 7-8 years to perfect. This is an incredibly well engineered piece of software with millions of lines of code. Achieving the balance of fastest WPF Chart performance, but also high flexibility and depth of features required six iterations and several complete re-writes along the way.
- SciChart Mobile (iOS/Android) took us 3-4 years to build. The mobile platforms introduced new challenges such as running on low-power or slower CPU hardware, and the overall efficiency of algorithms had to be investigated.
- SciChart.js was completed in under a year. This acceleration of our multi-platform rollout is a direct result of our investment into a common/shared C++ codebase.
Having a common C++ codebase allows us not only to have the fastest chart libraries across platforms, but also well tested libraries due to the number of users across platforms, and a set of libraries which is more efficient and to maintain and faster to market for new platforms.
Our investment into the Visual Xccelerator Engine puts SciChart in a unique position amongst chart component vendors. Should a new platform be created tomorrow, or should our customers request an existing platform, we can build it and fast.
What’s Next for SciChart?
We’ve come a long way, and while this vision of cross-platform chart libraries is complete, we are by no means done.
2021 and onwards we aim to do the following:
- Continue to support and maintain our award-winning, cross-platform chart libraries.
- Add features based on requests from our customers in the Feature Request system, which could include chart types, minor features or even entire platform ports.
- Build layers on top of SciChart: for example we now have the potential to move into data-analytics space or build services which our users require.
- Consult for our customers – which we are already doing – we provide customisation & consultancy services to build enhancements or entire applications as requested by customers who want to work more closely with our development team for a fee.
One thing is for sure, that the excellence you’ve seen from SciChart in the past is core to our work ethos both now and in the future, we aim to keep going and keep delivering for our customers and continue adding value to them in 2021 and beyond!
What do you want to see next from SciChart?
We practice customer-driven development at SciChart and we’ve always been keen to hear your requests to steer our roadmap. So, if there’s something specific you want to see from us, please do not hesitate to use the feature-request system, or contact us directly.
Thanks for your time for reading this, and a big thank-you to our customers who have supported us this year and beyond! As always, your feedback is welcome and if there’s anything you need, then by all means contact-us and we will be glad to help!
Best regards,
Andrew
Managing Director,
SciChart
Related Posts
