SciChart’s Cross-Platform Vision Complete!
SciChart has achieved a great deal in the past year, notably the pace of large releases has really increase in […]
As we come to the end of the year I’d like to take a moment to recap 2023 for SciChart, our achievements, what we have done for our valued customers and share a glimpse of what’s coming in the future.
Being a customer & user-centred business we believe in being transparent about our successes & failures, and we work hard to deliver value. The article below shows where we’re at today, which areas we can improve and what we’re planning in the coming year.
Let’s take a look starting with the financials 👉
SciChart is now in its 11th year and against a challenging economic backdrop, we’ve posted both growth in revenue & a healthy profit for the current financial year.
Some stats for our Financial year which ended on November 30th:
In addition to this:
We are an independent, privately owned business, and we have never taken on investment or debt. We’re not planning to change that, and will be investing in growth for 2024 from our own reserves. More on that later.
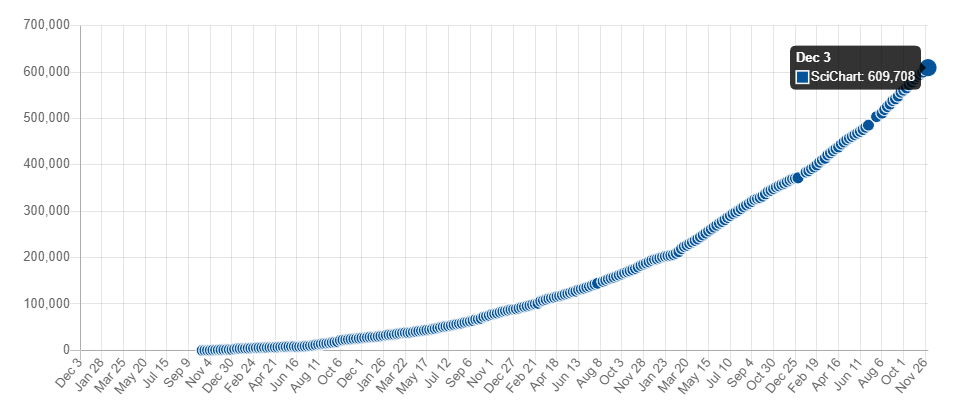
With over 600k downloads on NuGet, and 3,000 downloads per week on npmjs, and 150k downloads on Maven SciChart continues to grow in popularity. Almost a million downloads across all platforms and package managers for SciChart. Check out this graph (provided by npmtrends.com) showing the growth in Nuget Package downloads for SciChart WPF.
Our Github repositories such as SciChart.Wpf.Examples, Js.Examples and iOS.Examples / Android.Examples have a combined ~600 Github stars.
If you didn’t know, you can clone the examples/demos source code for all our demo apps at the above repositories, plus many other helpful boilerplates and getting-started guides.
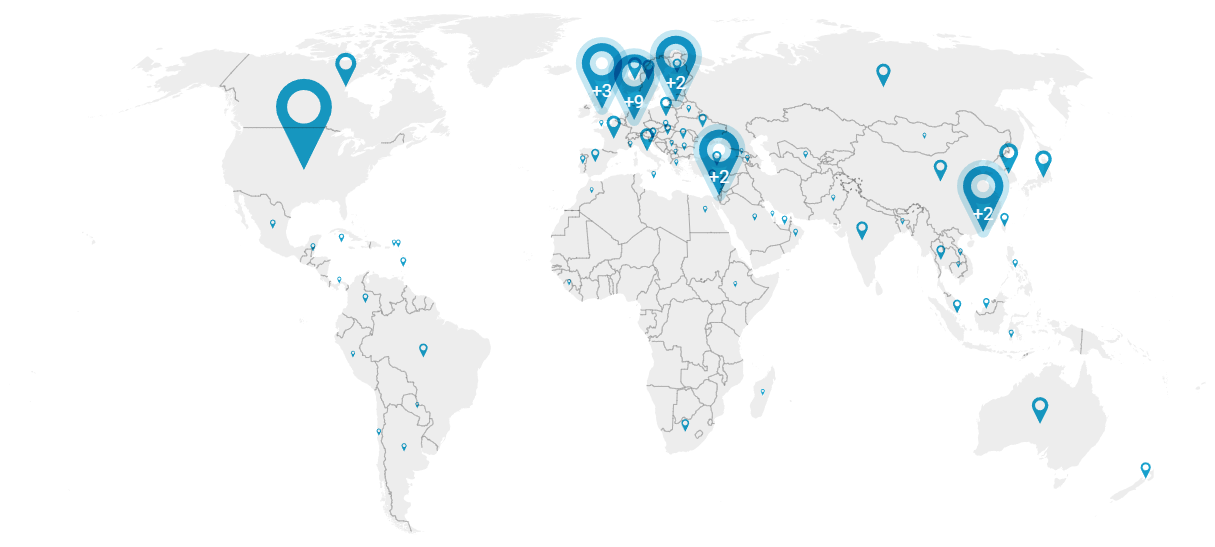
We have over 12,000 customers in ~90 countries which use SciChart. By far the largest userbases are found in USA and Europe, however it’s fascinating to see that SciChart is used all over the world in projects which need high performance WPF, JavaScript, iOS and Android charts.
It’s been a feature-packed year and we have a number of releases which have made it into production in 2023. Here’s a selection of major releases with links to the release notes:
In addition there’s been a number of nightly builds (hot-fix builds) for fixes to bugs reported by users:
By popular demand we now have changelogs detailing minor updates and nightly builds. You can find these under the main menu -> Developers -> Change logs.
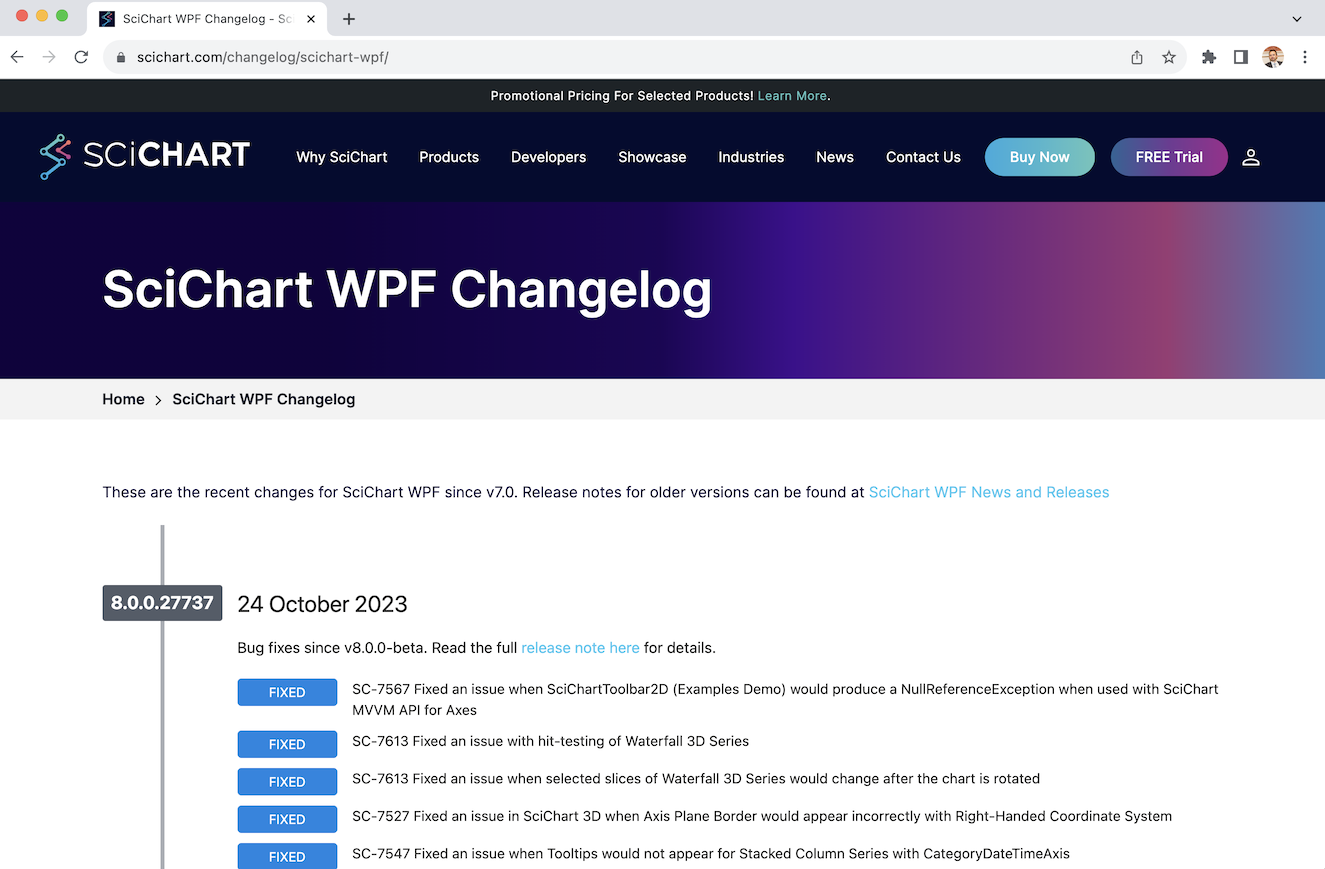
We will be updating these on each hotfix build so you can quickly at a glance see & search what’s changed in SciChart.
One of the things SciChart is renowned for, and one of our USPs is tech support.
In 2023, our team handled 2,503 priority support incidents, technical enquiries, bug reports and requests for assistance from our customers. More than 10 per working day.
In addition to this, we answered around 300 questions on our community forums, bringing the total number of publicly searchable forum questions for SciChart WPF, JS, iOS & Android to over 4,000.
On priority support, the average time to first response was slightly longer than the 24-hours we strive for, however, customer satisfaction remains high, with the following ratings (result of user survey after support ticket closed).
| Licensing Support | 4.67 / 5.0 |
| Sales (All platforms) | 4.91 / 5.0 |
| Support (JavaScript) | 4.78 / 5.0 |
| Support Android | 5.00 / 5.0 |
| Support WPF | 4.26 / 5.0 |
| Average | 4.72 / 5.0 |
Two things I’d like us to improve on in 2024 are having a faster time to first response, and a higher rating for SciChart WPF support. It’s always been our goal to have a number near 5-stars.
I’ve already spoken to the team to find out ‘what happened here’, systems and processes had some trouble earlier in the year, which have since been resolved.
To continue to maintain high levels of support satisfaction, in 2024 we plan to invest in support-desk software, processes and systems to provide better and more comprehensive answers (more on this below).
We have a number of future releases in progress or planned. These include:
In Q1 2024 we aim to swap our support-desk for a state of the art system. This will be more efficient and provide a better user experience to both our customers and staff resulting in time-savings.
We’re also fixing the search-as-you-type search on the scichart forums by completely re-implementing it in C# and Azure. Previously when you asked a question our search engine provided similar questions. We’re migrating and improving this system to give you reliable results at various places on the website when you search or ask a question.
Combining these systems:
… we hope to achieve a really excellent support system in 2024 which will allow our team to be more efficient, and serve our customers better saving you time & money too.
We took on a full-time hire this year just to maintain our growing back-end systems.
Soon, we expect to release:
There’s a lot coming soon to make the sales & licensing process more streamlined both internally and externally.
There’s a lot of stats above and talk about pricing & licensing. However, at our core we are a business that believes in doing something good & enabling cutting edge science & technology.
One last thing I wanted to talk about. As well as focussing on commercial success we are committed to supporting research & development. For example: new medical advancements, cancer research and more through our free educational licensing program.
In the last year we gave away 33 licenses of SciChart WPF, JS, iOS and Android worth $50,000 to universities & non-profit medical research organisations. Plus, we released the community-license version of SciChart.js meaning it can now be used in non-profit applications.
Two notable case studies under our free educational licensing program that we’re immensely proud of are below.
Neurorestore, a swiss non-profit research organisation, developed implants with precise electro-stimulation implants to allow paralysed patients with severed spine injury to walk again. Watch the video below to see an overview of their incredible research.
This cutting-edge research was documented in Nature magazine and reported on by BBC News earlier this year.
Neurorestore contacted us to say that SciChart WPF had been used to visualise waveforms provided by the electrostimulation modules during research. Their application is visible in the video above at 2m46s.
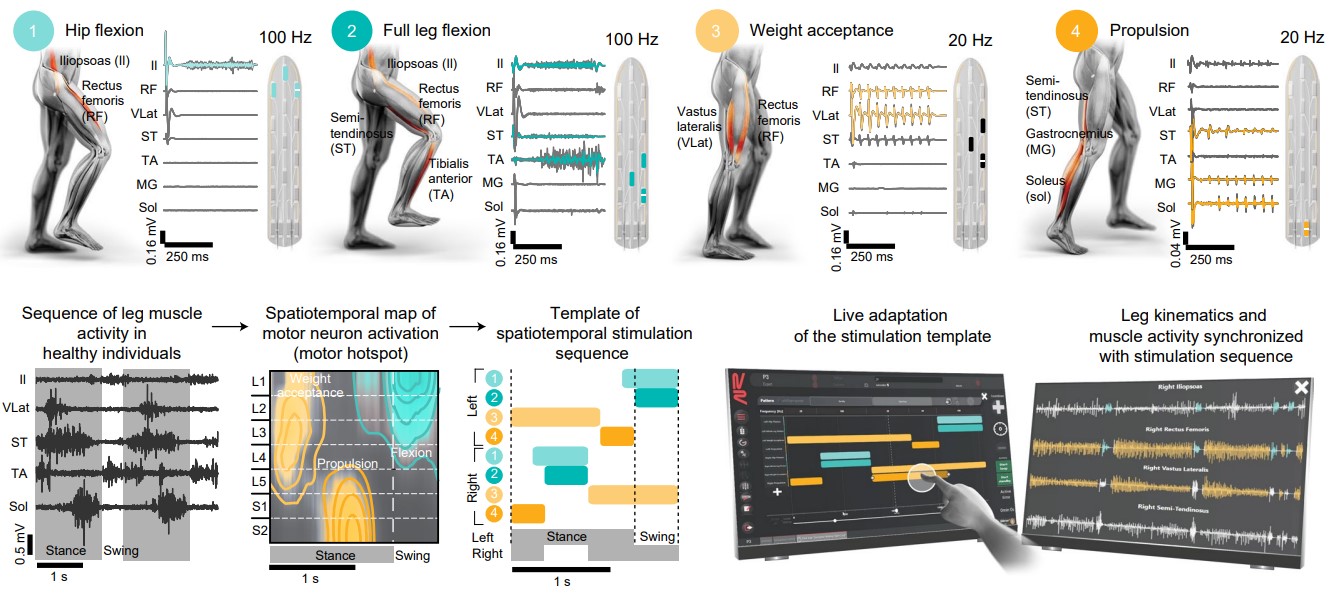
This is an incredible advancement in science & technology and we’re blown away by the work of the researchers and it’s far-reaching impact.
The second project is a research team we’ve been working with for a while. Also under our free educational licensing model, the University of Illinois created high-definition Infrared Spectroscopy for diagnostic tissue imagine (tumour/cancer tissue diagnosis). This involved the visualisation of massive (100 billion cell) datasets of 2D Heatmap data in real-time and had far-reaching impact for reduction of tissue biopsy diagnosis time.
Now, in combination with the Mayo Clinic – a not for profit cancer care clinic – the researchers have developed a new type of mid-infrared (mid-IR) microscope for chemical imaging, using a part of the electromagnetic spectrum known for it’s ability to provide detailed molecular information.
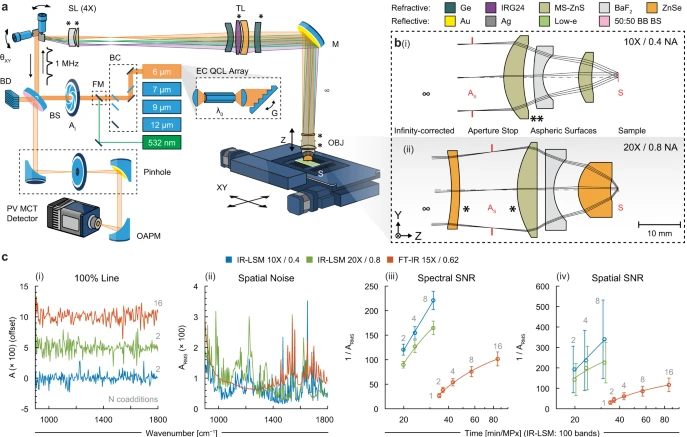
This new microscope is designed to be much faster and produce higher quality images than current models. It uses a special design with custom optics to scan large areas quickly and with great detail, making it practical for analyzing biological samples like tissues without needing special labels or dyes.
This incredible advancement will benefit cancer research by enabling rapid, detailed, and non-invasive imaging of tissues at a molecular level, facilitating better understanding and diagnosis of cancerous changes.
Cancer research is an area close to my heart. My wife was diagnosed with cancer in 2016, so we’ve seen it first hand. We’re proud to play a part in the fight against this and will gladly donate SciChart licenses to qualifying academic institutions carrying out cancer research under our educational licensing program.
I’m really proud of what our team has achieved this year, against what was a challenging economic backdrop. I’m of the opinion that 2024 will be easier and we are positioning for massive growth.
The team at SciChart are incredibly hard working, and have handled a lot – both in terms of releases, features, bug fixes and technical support.
Our customers are also fantastic, and continue to leave us 5-star reviews which are really encouraging. Each one of these gets shared with the team. I’d like to extend our heartfelt thanks to our loyal customers without whom, all of this would not be possible.
If you want to leave us a review and send some ⭐⭐⭐⭐⭐, you can do so right here.
If you’re a new customer to SciChart or planning to use our software, let me say you will not find a harder working team, or a more flexible & powerful chart library, you’re absolutely in the right place. Finally, a big thank you to our customers over the past year for your business.
Best regards,
Andrew
Managing Director, SciChart
Related Posts
![]()
Queens Award for Innovation
Proud winners of the Queens Award for Innovation, 2019. Awarded on account of our innovative graphics engine which underpins the SciChart library and enables our world-beating charting performance
![]()
National Business Awards
Highly Commended for Lloyds National Business Awards, 2019. Awarded on account of our innovative graphics engine and impressive customer base
![]()
National Technology Awards
Awarded “Healthcare Tech of the Year” at the 2025 National Technology Awards – a top UK recognition for breakthrough innovation in technology.

Reviews
SciChart has received hundreds of verified, 3rd party reviews