DirectX Compatibility in WPF Charts with SciChart
SciChart now features an optional DirectX10 based renderer. This is currently included as an add-on to the SciChart High Performance […]

We’re delighted to announce SciChart WPF v7.0 has now completed it’s BETA testing phase and SciChart WPF v7.0.1 build 27055 has been released! This update includes a number of stability fixes and enhancements.
There is a number of new features, examples and improvements in SciChart WPF v7.0. We’ve compiled a list over at the page SciChart WPF v7.0 Released. Take a look! There are over ten new features, three new examples and many improvements to our High Performance WPF Chart Library
Added support of new Viewport orientation mode in SciChart WPF 3D. In addition to existing mode with Y-Axis pointing upwards, now it is possible to set up 3D Charts to have Z-Axis pointing upwards. This setting is applied globally to all SciChart3DSurface instances. Also, it is possible to change Viewport 3D orientation in runtime. By default, all SciChart3DSurfaces appears with Y-Axis upwards orientation.
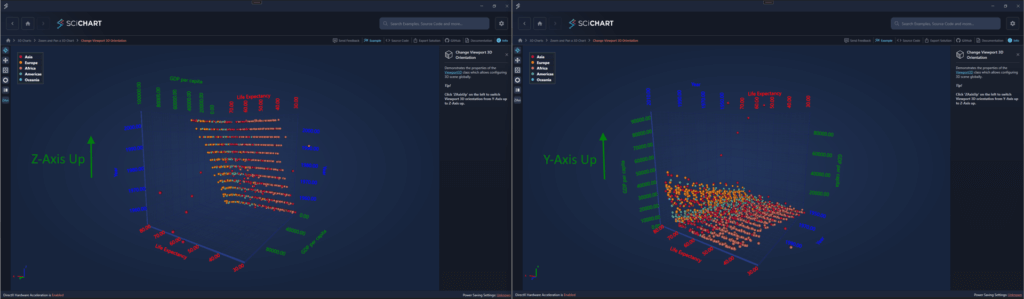
To specify desired Viewport 3D orientation, call Viewport3D.SetViewportOrientation(Viewport3DOrientation) static method:
// Change Viewport 3D orientation
Viewport3D.SetViewportOrientation(Viewport3DOrientation.ZAxisUp);This feature allows specifying Zero position for 3D Column series relatively to YAxis. By default, all 3D Columns begin at XZ plane position. Now it is possible to set Y-Value at which 3D Columns will start:
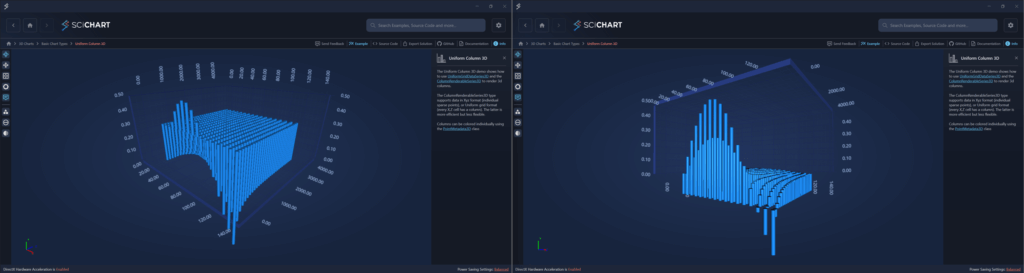
This can be achieved setting ZeroLineY property on ColumnRenderableSeries3D instance:
<s3D:SciChart3DSurface.RenderableSeries>
    <!--  To create a 3D Columns Chart, create a ColumnRenderableSeries3D. Optionally specify ZeroLineY, ColumnShape, Opacity  -->
        <s3D:ColumnRenderableSeries3D ZeroLineY="-0.15"
                                      DataPointWidthX="0.8"
                                      Opacity="1"/>
</s3D:SciChart3DSurface.RenderableSeries>This is a list of breaking changes in SciChart v7.0.
SciChart WPF v7.0 is available by:
Please ensure you uninstall the previous version(s) of SciChart before installing the latest version as this can prevent some issues in the upgrade process!
We welcome your feedback! Please let us know what you think about our new features, examples and improvements. You can contact our friendly, helpful team at any time!
Related Posts
![]()
Queens Award for Innovation
Proud winners of the Queens Award for Innovation, 2019. Awarded on account of our innovative graphics engine which underpins the SciChart library and enables our world-beating charting performance
![]()
National Business Awards
Highly Commended for Lloyds National Business Awards, 2019. Awarded on account of our innovative graphics engine and impressive customer base
![]()
National Technology Awards
Awarded “Healthcare Tech of the Year” at the 2025 National Technology Awards – a top UK recognition for breakthrough innovation in technology.

Reviews
SciChart has received hundreds of verified, 3rd party reviews