SciChart for Avalonia XPF v2.0 Released!
SciChart is thrilled to announce the release of SciChart for Avalonia XPF 2.0 – a major update that brings all features and improvements […]

We’ve moved over to a new format for communicating our releases and updates of our high performance JavaScript Charts library, by publishing a rolling changelog of every fix or enhancement in SciChart. You can find the changelogs in the top menu at Developers -> Changelogs -> SciChart JS ChangeLog
Today we have released v3.3.560 of SciChart.js. This is a cumulative update which contains very important fixes and features since our last announced release, version 3.2.
Version 3.3 contains important fixes including one fix to licensing which can affect production apps. It is backward compatible to v3.x, and it is highly recommended for all users to update. More details below.
IMPORTANT! Licensing issue in version range 3.2.446 to 3.2.555 By far the most important issue we’ve fixed is a licensing issue in SciChart.js, which affected version range 3.2.446 to 3.2.555. These versions have been marked as deprecated in npm.
This issue is expressed as a license expired error where you can see the error message “Sorry! This version of SciChart is too old to be used for the community edition. Please update to the latest version” even if a license key has been applied.
The resolution to this is as follows:
Update your application to using SciChart.js v3.3 or greater
If you are unable to update SciChart.js to v3.3 there is a workaround in code which can also be applied. Contact tech support if you require more information.
A number of new features & enhancements to the API have been included since version 3.2, these include:
We’ve added a new modifier type, the VerticalSliceModifier plus an example showing how to use it. The VerticalSliceModifier example demonstrates our newest modifier, which allows you to place vertical lines on the chart with tooltips. Lines are draggable, selectable and can be added/removed. More than one line may be added to the chart.
We made multiple improvements to the PaletteProvider API to allow better performance. The PaletteProvider is the API which allows per-point colouring on data-points (bars, line segments, scatter points, bubbles) in SciChart.js. Currently this is a function which is run once per render allowing you to modify the data-point colour dynamically. IAdvancedPaletteProvider interface allows you to create a PaletteProvider with optionally cached outputs for all data-points. Rather than calling a function point-by-point to evaluate data-point color, the IAdvancedPaletteProvider allows you to return an array of colors for data-points. This is significantly faster for cases which require frequent color changes on the chart or graph.
Official documentation for the IAdvancedPaletteProvider will be added shortly. Typedoc API docs can be found here.
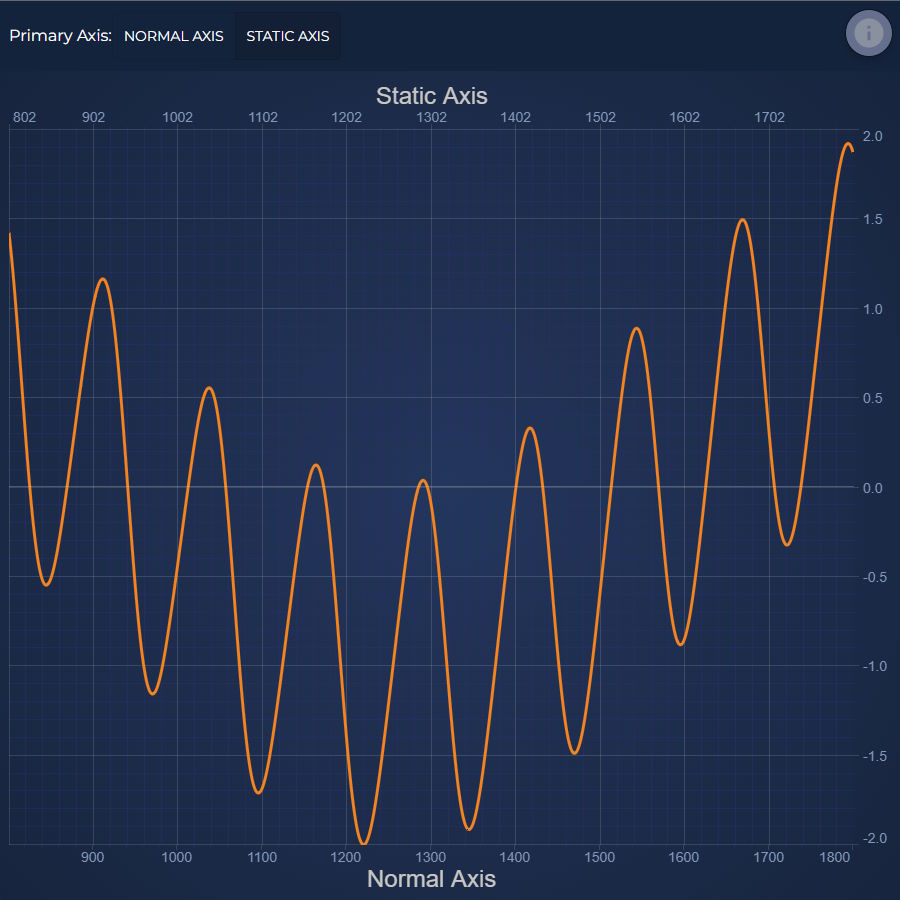
We’ve added a property to AxisBase.isStaticAxis. When set to true:
AxisBase.isStaticAxis = true then ten labels / major gridlines will be placed on the chart, always at the same positionAxis.MaxAutoTicks defines the number of labels. E.g. when set to 10, you will get 10 labels / major gridlines equally spaced over the chartAxis.visibleRange programmatically, or by zooming, the labels / gridlines will stay in the same place, however, label values will updateOfficial documentation for the Static Axis feature will be added shortly. Typedoc API docs can be found here.
RenderDataTransforms is a new low level api that allows you to transform your data just before it is drawn. SciChart currently uses it this internally to do spline interpolation, but it has the potential to support all kinds of cool features, like changing the color of a line between data points (by adding extra geometry), and applying multiple different line styles and pointMarkers to a single series.
Official documentation for RenderDataTransforms plus demos will be added shortly. Typedoc API docs can be found here.
In addition, a number of new demos have been created since the v3.2 release of SciChart.js. These include:
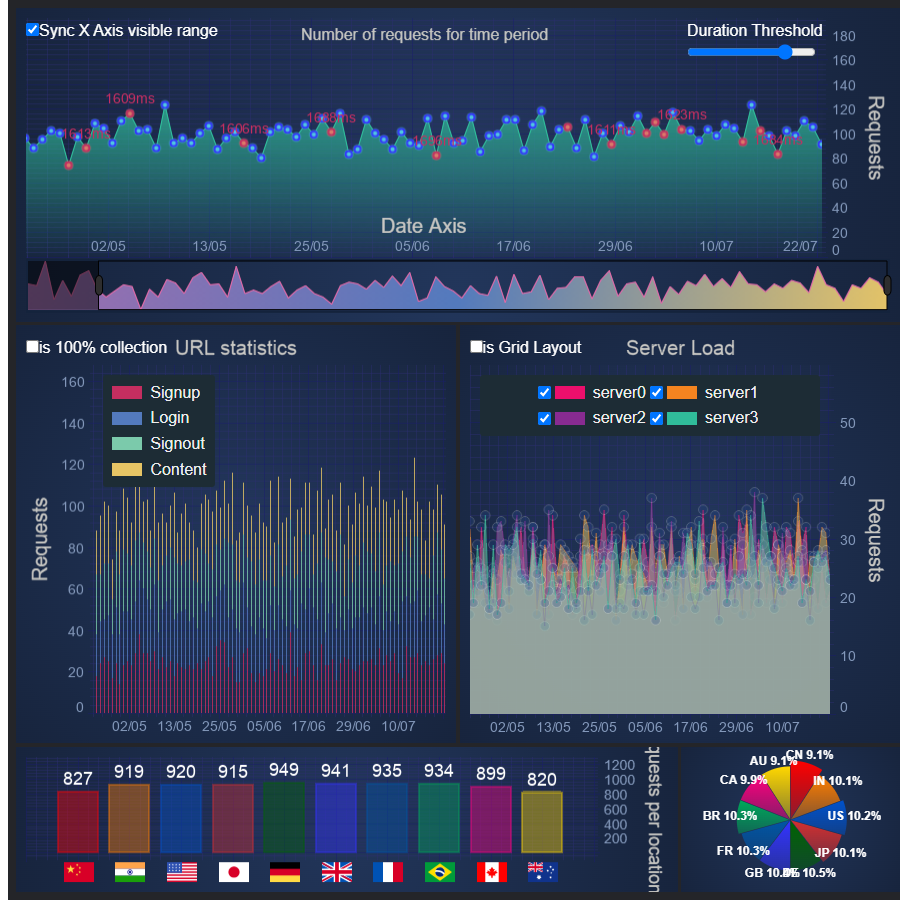
Shows how to create a rich interactive 'Grafana style' server traffic dashboard in React JS using SciChart. Several charts are linked together with synchronized zooming and panning. The demo features drilldowns, hover styling events, hoverable tooltips and more … Continue reading React / JavaScript Server Traffic Monitoring Dashboard demo
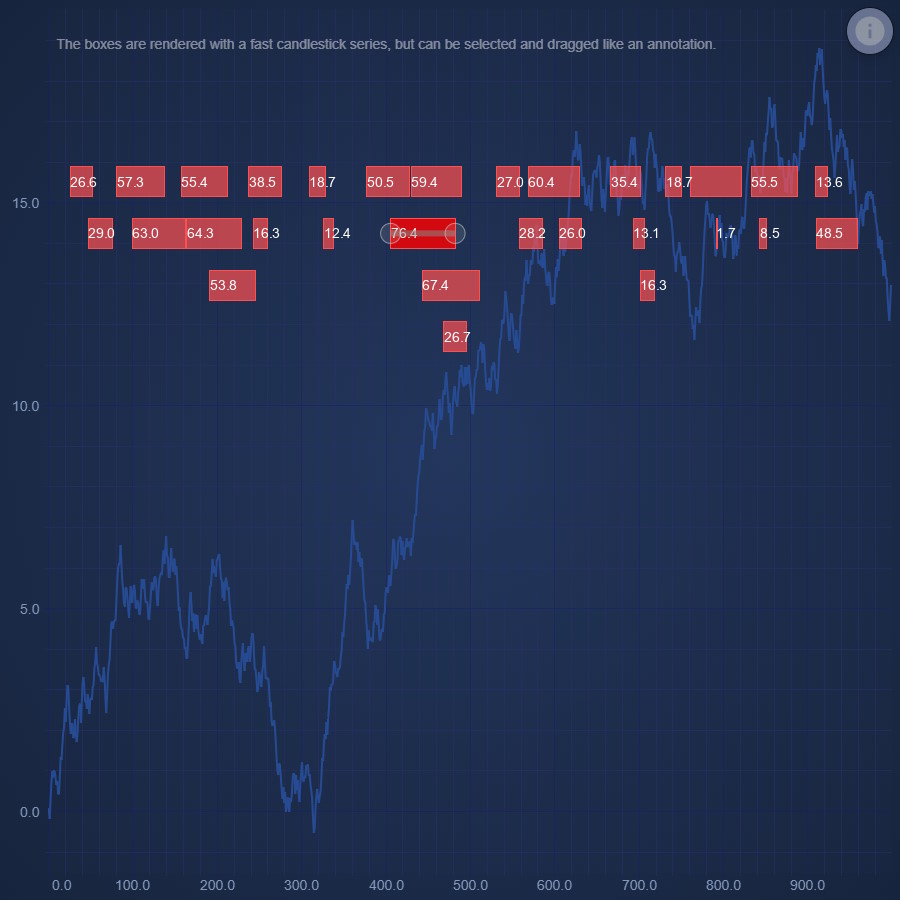
Range bars can be added to a JavaScript chart with optional labels. In this demo, we show how to use a combination of custom rendering and the chart modifier API to enable click selection and dragging of these range bars … Continue reading Draggable Range Bar Event Markers with Labels in JavaScript
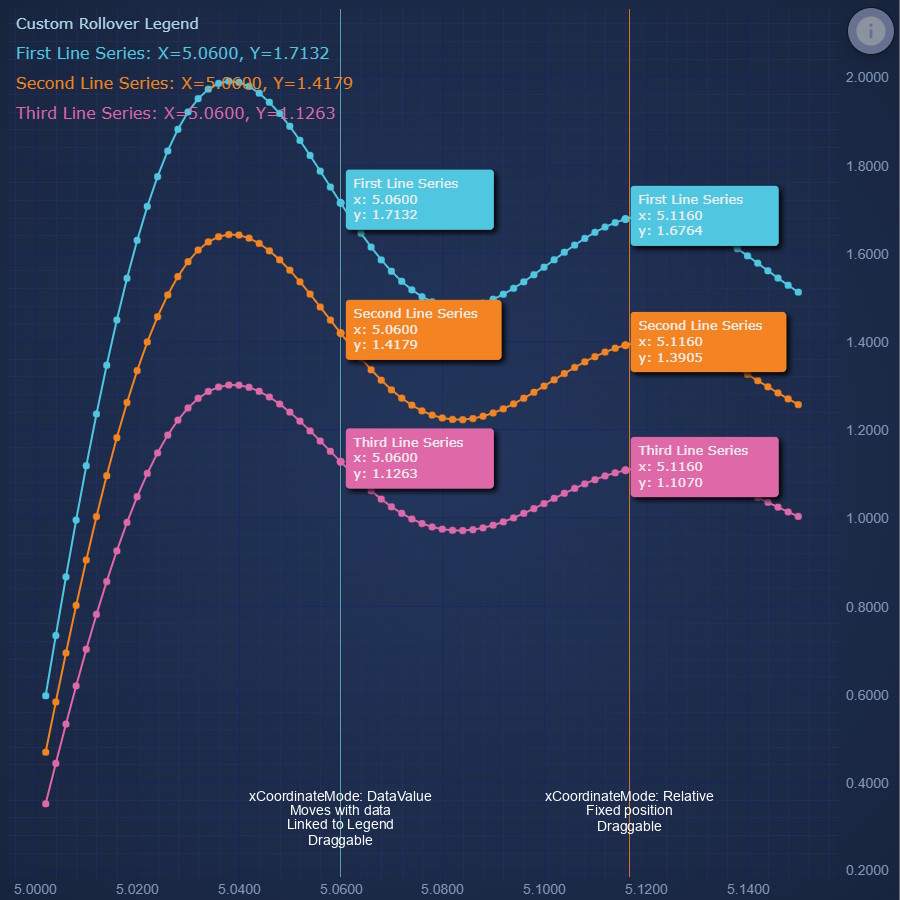
Learn how to use the VerticalSliceModifier, a new feature in SciChart.js which allows you to place one or more vertical lines on the chart, which slice the time-series and display a tooltip. Lines can be added, removed, selected or dragged. Multiple lines can be added to a single chart. … Continue reading VerticalSliceModifier Multiple Tooltip Line Example
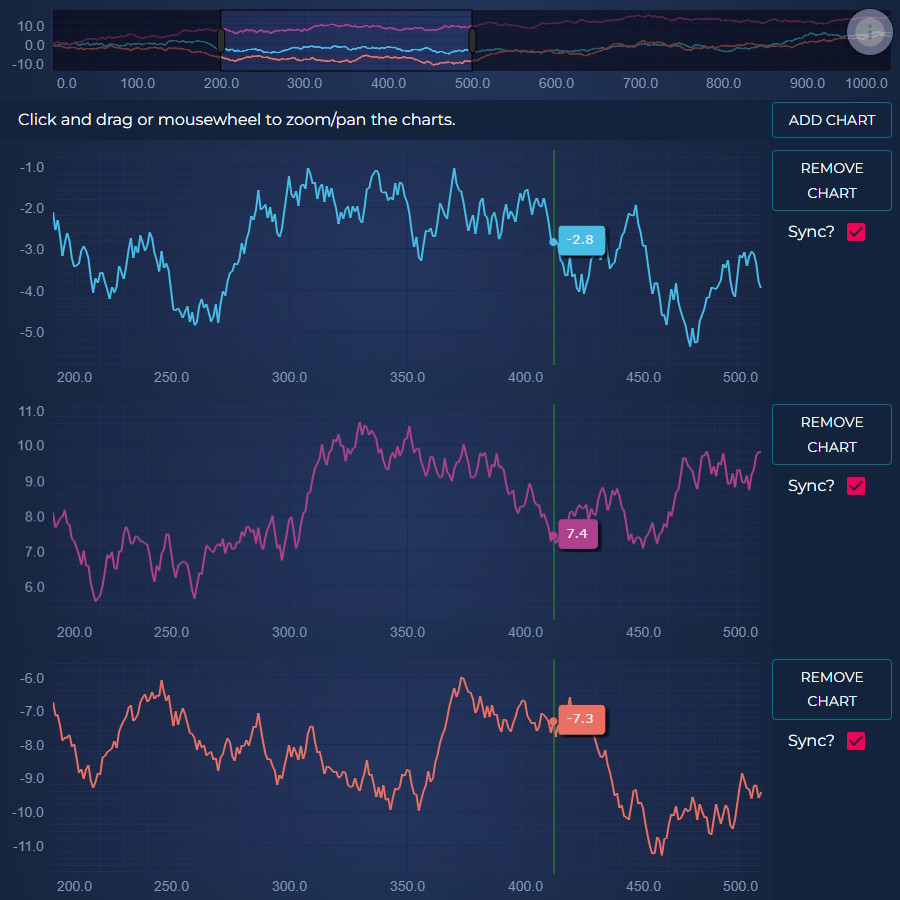
Using SciChart.js APIs shows how to dynamically add and remove charts to a synchronized group. All charts zoom, pan together. Tooltips synchronize across charts. Chart panes may be removed from the sync individually. This allows for highly dynamic charts with multiple panes … Continue reading Synchronize Multiple Charts in React & JavaScript
Since version 3.2 was released in July 2028 there are also lots of bug fixes which have been deployed to SciChart.js. These have been rolled into v3.3. You can see a full breakdown of bug fixes and their dates/version in the ChangeLog.
dataSeries.FindIndex and fix some minor bugs there.isActiveSubChartEvent added to ModifierMouseArgs. This is useful for Sub Charts with a modifier group.DefaultPaletteProvider still had shouldUpdatePalette false. Default false until v4DataPointSelectionModifierSCRTDoubleVector does not push_pack correctly for capacity 1shouldUpdatePalette method to your PaletteProvider and return false if the palette can be reused. We will be changing this default in version 4 to reuse if at all possible.RenderDataTransforms. This is a low level api that allows you to transform your data just before it is drawn. SciChart currently uses it to do spline interpolation, but it has the potential to support all kinds of cool features, like changing the color of a line between data points (by adding extra geometry), and applying multiple different line styles and pointMarkers to a single series. Expect more documentation, demos and features using this in 2024.isRangeIndependant and a function shouldUpdatePalette to control when palette recalculation should occur. You can now even take full control of the palette by implementing IAdvancedPaletteProvider, which gives you a single function call for all the data rather than a call per point.RenderDataTransform api and used it for spline seriesisRangeIndependant and shouldUpdatePalette to IPaletteProvider to control palette reuseIAdvancedPaletteProvider interface. This is a single method called instead of the per-point overrides. Its parameters give you access to the full data and paletteyRangeMode property to renderableSeries and set the default on this to revert to previous behaviour where the points just outside the visibleRange will be included in autoRange. This fixes issues where digital lines were escaping the axis when used on stacked axes.coordinateMode Relative now works correctly on a stacked axishitTest could be offset when using CategoryAxisRolloverModifier is removed and readdedVerticalSliceModifier should not be able to be dragged off the chartshowAxisLabel property for rollover and vertical sliceseries.isVisible does not update legend visibility checkboxTextAnnotationshadowEffectColor on theme now applies to tooltips. To set individually use tooltipShadow for CursorModifier or renderableSeries.rolloverModifierProps.shadowColor for RolloverModifier AFTER the modifier has been addeduseWasmFromCDN to loadWasmFromCDN to avoid eslint errorsaxisTitleStyle option type should include rotationcliptoYRange on renderableSeries allowing clipping to vertically stacked axis rangeisStaticAxis property to axis which causes the labels and major gridlines to keep their initial positions when the visible range changesSciChartVerticalGroup now synchronises axis widthslabelRadiusAdjustment should be a constructor option for SciChartPieSurfaceObservable.asArrayVerticalSliceModifier at demo.scichart.com/javascript-chart-vertical-slice-modifierVerticalSliceModifier. Looks like the RolloverModifier, but programatically placed at a particular data or pixel positionseriesViewRectaxis.isVisible no longer breaks labelsparseColorToHexStringArgb with zero opacity overrideisEnabled for DataLabelProviderswasmcontext is being createdaxis.clipToXRange which allows you to disable this.clipToXRange property to allow for disabling the new clipping to visibleRange for x axisSciChart.js v3.3 is available by:
Check npm for the latest version.
Don’t forget to see our Tutorials on setting up Npm projects with Webpack!
For developers using vanilla JavaScript (no Node Package Manager), you can load SciChart.js directly in browser. Add this script to your Html head and away you go.
// Add this script to head. For Prod we recommend setting a specific version number
// Include script from https://www.jsdelivr.com/package/npm/scichart
<script src="https://cdn.jsdelivr.net/npm/scichart@3/index.min.js" crossorigin="anonymous"></script>

// Import your types
const { SciChartSurface, NumericAxis, FastLineRenderableSeries } = SciChart;

// Now Configure SciChartSurface in code to load the wasm file from CDN
SciChartSurface.useWasmFromCDN();

// Now create a SciChartSurface as you would normally!
const { sciChartSurface, wasmContext } = await SciChartSurface.create("div-id");
Related Posts
![]()
Queens Award for Innovation
Proud winners of the Queens Award for Innovation, 2019. Awarded on account of our innovative graphics engine which underpins the SciChart library and enables our world-beating charting performance
![]()
National Business Awards
Highly Commended for Lloyds National Business Awards, 2019. Awarded on account of our innovative graphics engine and impressive customer base
![]()
National Technology Awards
Awarded “Healthcare Tech of the Year” at the 2025 National Technology Awards – a top UK recognition for breakthrough innovation in technology.

Reviews
SciChart has received hundreds of verified, 3rd party reviews