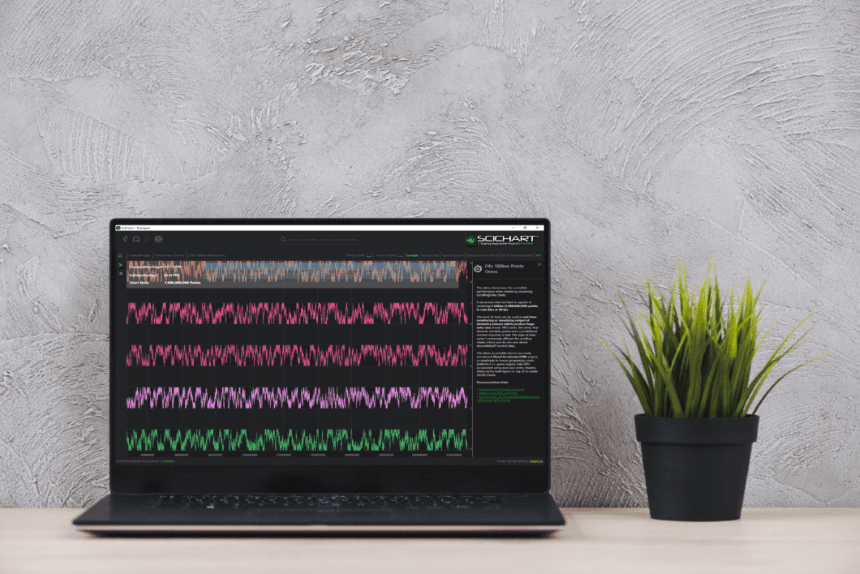
We’ve moved over to a new format for communicating our releases and updates of our popular WPF Charts library, by publishing a rolling changelog of every fix or enhancement in SciChart.
You can find the changelogs in the top menu at Developers -> Changelogs -> SciChart WPF ChangeLog
What’s New in v8.5 of SciChart’s WPF Charts?
This release (v8.5.0 build 28148) is a cumulative update with fixes and minor enhancements which is backward compatible to version 8.0 of SciChart WPF. It’s recommended for all users on v8.x to upgrade.
To find out what is new since v8.3, read on below:
Features & Improvements
- SC-7659 Added rendering of special numeric values (such as Double.MaxValue, Double.PositiveInfinity, etc) to viewport edges for FastMountainRenderableSeries and FastLineRenderableSeries using the VisualXccelerator renderer
- SC-7904 Implemented configuring of AxisTitle visibility in SciChart3D through the AxisPlane API
- SC-7924 Added LightingController API to the Viewport3D class in SciChart3D that allows control over scene lighting
- SC-7844 Added support for the Foreground property on Axes, which now works alongside the TickTextBrush property
Bug Fixes
- SC-6229 Fixed an issue where DataDistributionCalculators did not update data distribution flags in the FIFO mode after certain operations with data
- SC-8030 Resolved issues with special numeric values (such as Double.MaxValue, Double.MinValue) not being recognized during VisibleRange calculations for Axes
- SC-7908 Fixed a regression where Axis3D.IsLabelCullingEnabled had no effect
- SC-7949 Fixed binding issues in SciChartLegend that caused BindingErrors in the Output window
- SC-8026 Fixed an issue where DataDistributionCalculators did not update the DataContainsNaN flag on data removal
- SC-8047 Corrected chart offset when setting AxisAlignment via a Style using Axis MVVM API
- SC-8049 Resolved an issue when an exception was thrown when manually disposing SciChartSurface objects
- SC-8052 Fixed an issue where 2D charts appeared with missing lines on exported images when downscaling occurred
- SC-7983 Fixed an issue where AxisMarkers, when used with SeriesValueModifier, would not appear for RenderableSeries if the MVVM API was utilized
- SC-8001 Fixed an issue where Offset and Scale filters would throw an exception when applied to a DataSeries containing unsorted data
- SC-7799 Fixed the appearance issues of a digital (stepped) FastBandRenderableSeries when few data points are visible in the viewport
- SC-7841 Resolved an issue with the incorrect rendering of FastBandRenderableSeries when Y1 values are identical
- SC-7960 Fixed a System.AccessViolationException occurring when a WaterfallDataSeries3D with an increased number of slices (Z Values) is assigned to a WaterfallRenderableSeries3D
More details can be found at the SciChart WPF Changelog
Breaking Changes
There is a potential breaking change in the 2D DataSeries API involving a single modification:
- Added a new property, DataContainsBoundaryValues, to the top-level interface IDataDistributionProvider. This update requires all implementors of IDataDistributionProvider, IDataSeries, IDataDistributionCalculator<TX, TY>, along with their derived interfaces, to include this property in their implementations.
Where to get it
SciChart WPF v8.5 is available by:
- Downloading the installer from our scichart.com/downloads page
- Using Install-Package or Update-Package from NuGet
- By cloning and compiling the examples source code on GitHub
- By cloning or downloading the SciChart source code on GitHub (source code customers only)
Please ensure you uninstall the previous version(s) of SciChart before installing the latest version as this can prevent some issues in the upgrade process!
Leaving Feedback
We welcome your feedback! Please let us know what you think about our new features, examples and improvements. You can contact our friendly, helpful team at any time!
Related Posts
