DirectX Compatibility in WPF Charts with SciChart
SciChart now features an optional DirectX10 based renderer. This is currently included as an add-on to the SciChart High Performance […]

SciChart WPF is now ten years young and still remains the best WPF Chart Control, and best WPF chart on the market!
Today we are pleased to announce continued improvement to our flagship product: SciChart WPF: v8.0. This update (v8.0.0 build 27737) includes a number of features & improvements. To find out what is new, read on below!
Version 8.0 at a glance:
- New 3D Axis Label, Title positioning algorithm in SciChart 3D
- Configurable Orientation for Axis Labels and Titles in SciChart 3D
- Added Styling for Axis Titles in SciChart 3D
- Configurable 3D Axis Cube Sides/Wall/Axis visibility
- Faster VisualXcceleratorEngine Startup, Async Startup and auto cleanup
- Multiple UI Threads Support for the VisualXccelerator Renderer
- Multiple Application Domains Support for the VisualXccelerator Renderer
- Improved 2D Text Drawing API
- Key Bindings for ChartModifiers
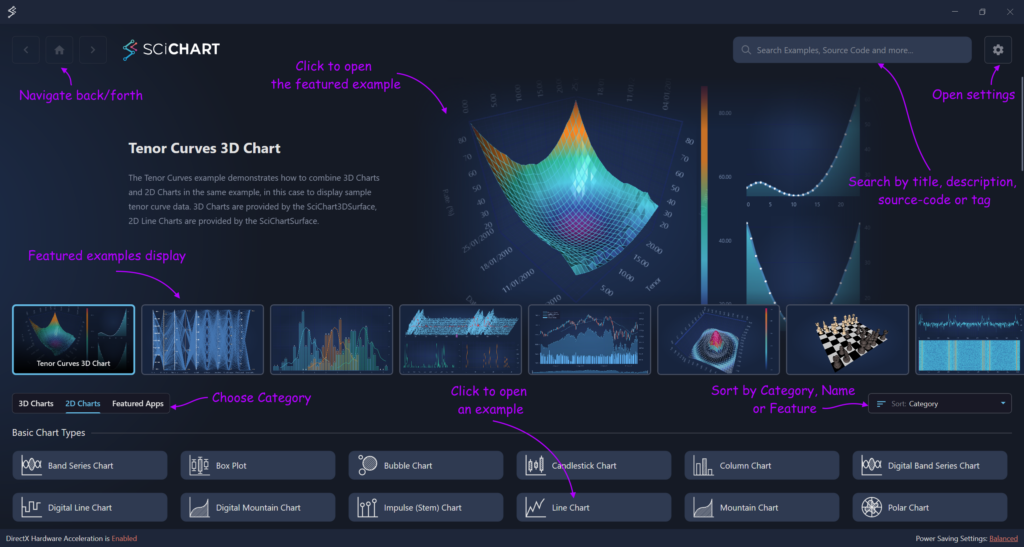
- Updated Homepage for the SciChart WPF Examples App
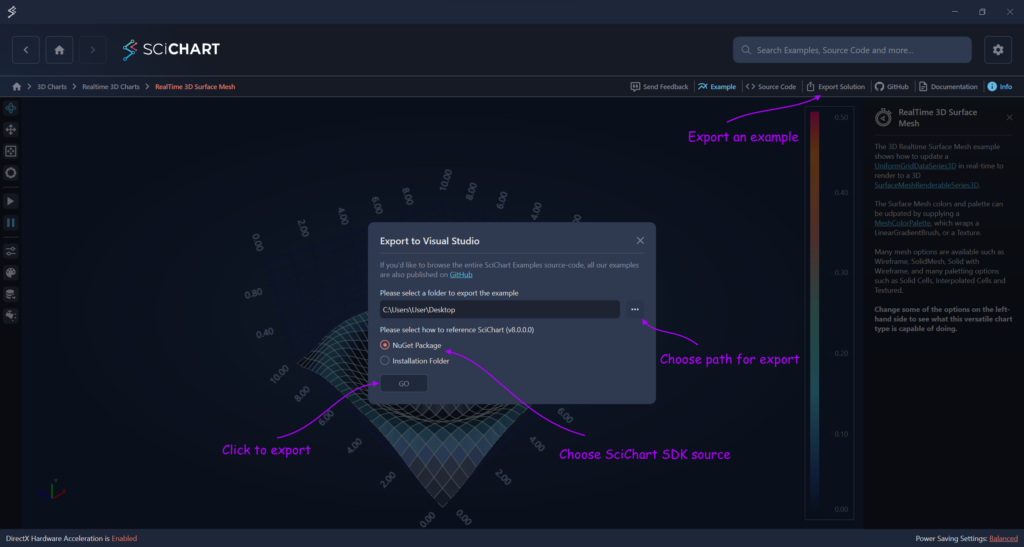
- WPF Examples Export with NuGet Packages
- Reworked a 3D Example
- 5x Faster Line Chart loading with Slim Line Series
- New DPI-Aware SciChartSurface Example in Sandbox
- Other Features & Improvements
- Documentation Updates
- Bug Fixes
- Bug Fixes Since v8 Beta
- Breaking Changes
Totally reworked positioning of Axis Labels and Axis Titles in SciChart 3D in order to provide better experience. Multiple cases of labels and titles overlapping have been resolved with the new positioning system:
Added the AxisTitleOrientation and TickLabelOrientation properties to the Axis3D class. They allow to specify desired orientation for the Axis Title and Axis Labels: Auto, Horizontal, Vertical (Vertical is not available for Axis Labels). Vertical and Horizontal orientation modes are relative to the screen boundaries:
These properties can be set in code as shown in the code snippet below:
<s3D:SciChart3DSurface WorldDimensions="200,100,200">
  <s3D:SciChart3DSurface.XAxis>
    <s3D:NumericAxis3D AxisTitle="X-Axis" AxisTitleOrientation="Horizontal" TickLabelOrientation="Horizontal" />
  </s3D:SciChart3DSurface.XAxis>
  <s3D:SciChart3DSurface.YAxis>
    <s3D:NumericAxis3D AxisTitle="Y-Axis" AxisTitleOrientation="Vertical" TickLabelOrientation="Horizontal" />
  </s3D:SciChart3DSurface.YAxis>
  <s3D:SciChart3DSurface.ZAxis>
    <s3D:NumericAxis3D AxisTitle="Z-Axis" AxisTitleOrientation="Auto" TickLabelOrientation="Auto" />
  </s3D:SciChart3DSurface.ZAxis>
</s3D:SciChart3DSurface>In earlier versions of SciChart 3D, Axis Title could not be styled separately from Axis Labels. Now, styling of Axis3D Titles is supported via the TitleStyle property in the Axis3D class. A custom Style with TargetType=”TextBlock” should be provided for styling the Axis Title. At the moment, styling options are limited to FontFamily, FontSize and Foreground settings.
The new styling is demonstrated in the “Style 3D Chart” example:
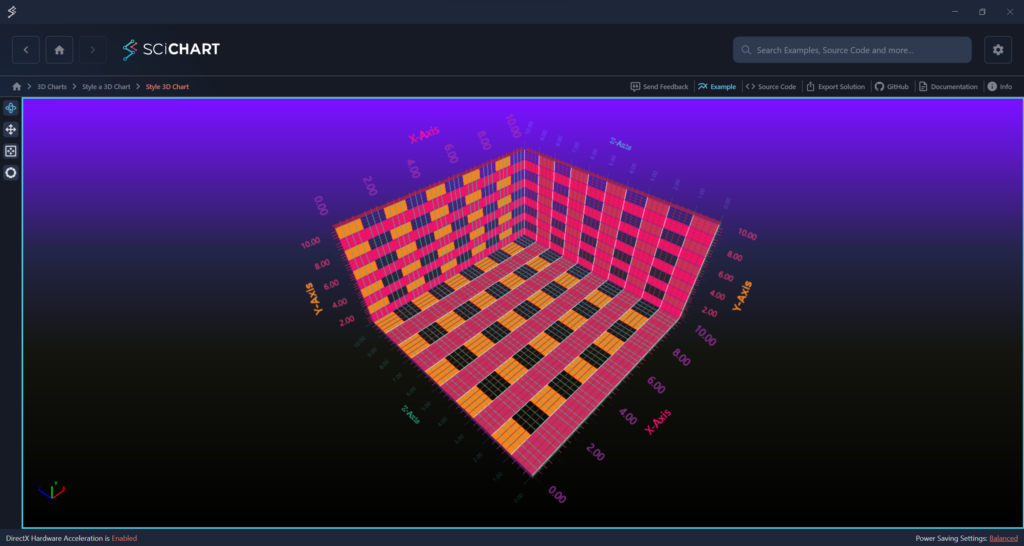
The code snippet below demonstrates how to provide a custom Style for an Axis3D Title:
<!-- Declare Axis Style with a Title Style -->
<Style x:Key="YAxisStyle" TargetType="s3D:AxisBase3D">
  <Setter Property="TitleStyle">
    <Setter.Value>
      <Style TargetType="TextBlock">
        <Setter Property="Foreground" Value="{StaticResource ExtraThemeStrokeBrush_5}" />
        <Setter Property="FontSize" Value="18" />
        <Setter Property="FontFamily" Value="Verdana" />
      </Style>
    </Setter.Value>
  </Setter>
</Style>

...

<!-- Apply Axis Styles to the SciChart3DSurface -->
<s3D:SciChart3DSurface WorldDimensions="200,100,200">
  <s3D:SciChart3DSurface.XAxis>
    <s3D:NumericAxis3D AxisTitle="X-Axis" Style="{StaticResource XAxisStyle}" />
  </s3D:SciChart3DSurface.XAxis>
  <s3D:SciChart3DSurface.YAxis>
    <s3D:NumericAxis3D AxisTitle="Y-Axis" Style="{StaticResource YAxisStyle}" />
  </s3D:SciChart3DSurface.YAxis>
  <s3D:SciChart3DSurface.ZAxis>
    <s3D:NumericAxis3D AxisTitle="Z-Axis" Style="{StaticResource ZAxisStyle}" />
  </s3D:SciChart3DSurface.ZAxis>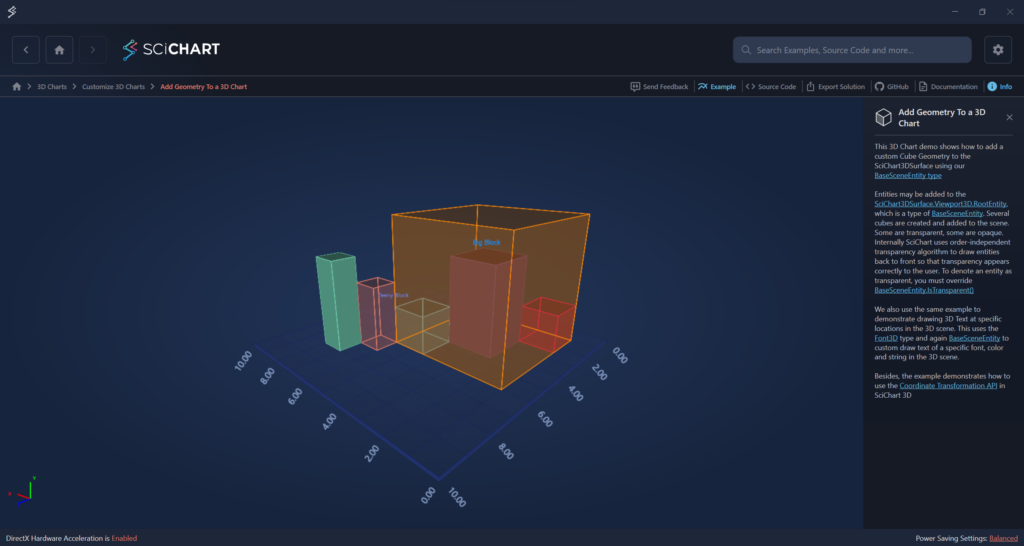
</s3D:SciChart3DSurface>Axis Cube Planes can be hidden via the AxisPlanes API, which is represented by three static classes ZxAxisPlane, XyAxisPlane, ZyAxisPlane in SciChart.Charting3D.Visuals.AxisLabels namespace. The classes define AxisPlaneVisibilityMode and IsPlaneVisible attached properties. They allow configuring visibility for individual planes of the 3D Axis Cube by specifying whether an Axis Plane should appear by setting the IsPlaneVisible property and also choosing the visible side of the Axis Plane via the AxisPlaneVisibilityMode property. This side visibility setting has three options: Negative, Positive or Auto, which correspond to the directions of World Coordinates in SciChart 3D.
This is demonstrated in the “Add Geometry to a 3D Chart” example:
The usage in code is as follows:
<s3D:SciChart3DSurface x:Name="sciChart3DSurface"
   WorldDimensions="400,400,400"
   s3D:ZxAxisPlane.AxisPlaneVisibilityMode="NegativeSide"
   s3D:XyAxisPlane.IsPlaneVisible="False"
   s3D:ZyAxisPlane.IsPlaneVisible="False">
<!-- Other SciChart3DSurface settings here -->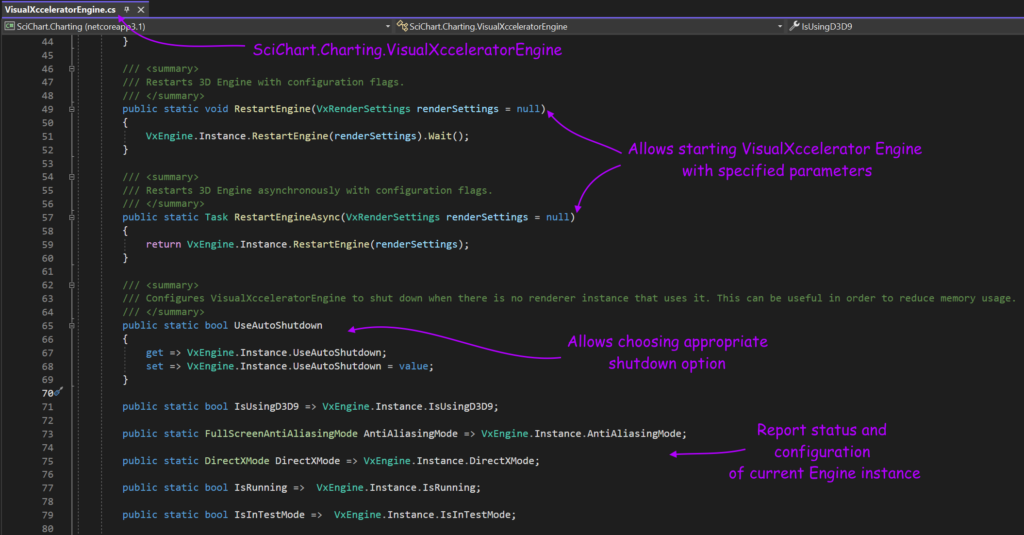
</s3D:SciChart3DSurface>Added API to manually control VisualXccelerator Engine. It does all drawing when VisualXccelerator renderer (hardware-accelerated renderer) is used.
The new API allows for improving startup speed of applications that use SciChart with VisualXccelerator renderer and provides more control over the Engine life time. Specifically, it is possible to start/restart the engine, choose when to stop it and inspect its status and configuration options during the runtime.
There is no explicit way to shut down the engine. This is done intentionally, since stopping the engine during rendering pass would cause a runtime error and result in a non-recoverable crash. However, setting the VisualXcceleratorEngine.UseAutoShutdown property to “True” makes the engine to shut down immefiately if there is no SciChartSurface using it. Otherwise, the engine will shut down when the last renderer instance that is using it is disposed or finalized.
The new methods and properties have been added to the SciChart.Charting.VisualXcceleratorEngine static class:
For example, this API is used to configure the VisualXccelerator Engine in the Bootstrapper of SciChart Examples Demo, as shown in the code snippet below. The full source code can be found in Sandbox on our GitHub:
try
{
  VisualXcceleratorEngine.UseAutoShutdown = false;
  VisualXcceleratorEngine.RestartEngine();
}
catch
{
  // Suppress Vx init errors. All rendering will occur with a fallback
}The VisualXccelerator renderer now supports multiple UI threads. We reworked SciChart API on the C# side that was used to control the VisualXccelerator Engine, adding appropriate synchronization mechanisms and thus allowing multi-threaded rendering. However, please note that underlying VisualXccelerator Engine works in synchronous manner and rendering is still synchronous in the SciChart native code.
This example on SciChart GitHub demonstrates how to create a WPF Application with a couple of Windows, where each Window has its own UI thread. Both Windows show SciChart charts that can be configured to use specific renderer via a Style for SciChartSurface found in App.xaml.
Application Domains is a .NET mechanism that allows isolating multiple Applications within a single native process.
Before SciChart v8, VisualXccelerator Engine that is used for SciChart 3D and hardware-accelerated rendering in SciChart 2D did not allow being shared across multiple Application Domains. Since SciChart v8, the engine allows being used in an application that utilizes multiple Application Domains.
However, such support is limited due to the essence of Application Domains, which is isolation at the managed layer. No communication is possible between different Application Domains which makes rendering synchronization impossible. And since renderign with VisualXccelerator Engine is synchronous in its nature, it doesn’t support parallel rendering calls which may be the case when multiple Application Domains use SciChart with the hardware-accelerated renderer.
This example on SciChart GitHub demonstrates how to use SciChart in a solution that uses multiple Application Domains.
Added the IRenderContext2D.MeasureText(string, float, FontFamily, FontWeight, FontStyle) method to the IRenderContext2D API.
It provides the means for measuring text size for the particualr renderer in use. The method should be used together with the IRenderContext2D.DrawText(Point, string, float, FontFamily, FontWeight, FontStyle, Color) method to find the size of a text and determine whether it should be drawn of not.
For example, this is how Heatmap uses these methods to draw text labels in cells:
var cellText = RenderableSeries.FormatDataValue(zValue, xInd, yInd);
var textSize = renderContext.MeasureText(cellText, fontSize, fontFamily, fontWeight, fontStyle);
if (textSize.Width < cellRect.Width && textSize.Height < cellRect.Height)
{
  var textPoint = new Point
  {
    X = cellRect.Left + (cellRect.Width - textSize.Width) / 2,
    Y = cellRect.Top + (cellRect.Height - textSize.Height) / 2
  };
  renderContext.DrawText(textPoint, cellText, fontSize, fontFamily, fontWeight, fontStyle, cellTextColor);
}Added the ExecuteWhen property to ChartModifiers that allows specifying a key modifier. When the key is pressed, ChartModifier will be enabled to execute its action.
This code snippet shows how to specify key modifiers in XAML:
<s:SciChartSurface.ChartModifier>
  <s:ModifierGroup>
    <s:RubberBandXyZoomModifier ExecuteWhen="Ctrl" />
    <s:ZoomPanModifier ExecuteWhen="Shift" />
    <s:CursorModifier ExecuteWhen="Alt" />
    <s:ZoomExtentsModifier />
  </s:ModifierGroup>
</s:SciChartSurface.ChartModifier>Download the demo installer today to see the new-look examples app. Don’t forget you can also clone it on Github here: github.com/abtsoftware/scichart.wpf.examples.
When exporting examples, there is a new option added that allows to reference the latest SciChart packages from NuGet. This is a handy option to start quickly with a new application that uses SciChart, for creating a demo project, or for making a small example to send to our support:
The “Add Geometry to a 3D Chart” example has been reworked to demonstrate usage of the Coordinate Transformation API and the new Axis Planes API in SciChart 3D.
Added a new example that demonstrates a custom SlimLineRenderableSeries.
It can be used in performance-demanding scenarios where display of large amount of line series (tens of thousands) is required. The SlimLineRenderableSeries does not derive from the WPF UI types and therefore has an advantage in construction time. This helps to improve chart loading time significantly (can be up to x5 times) in the use-case mentioned above. On the other hand, the drawback of this approach is that SlimLineRenderableSeries cannot participate in Binding and thus may be considered not suitable for MVVM scenarios.
The example can be found on SciChart GitHub.
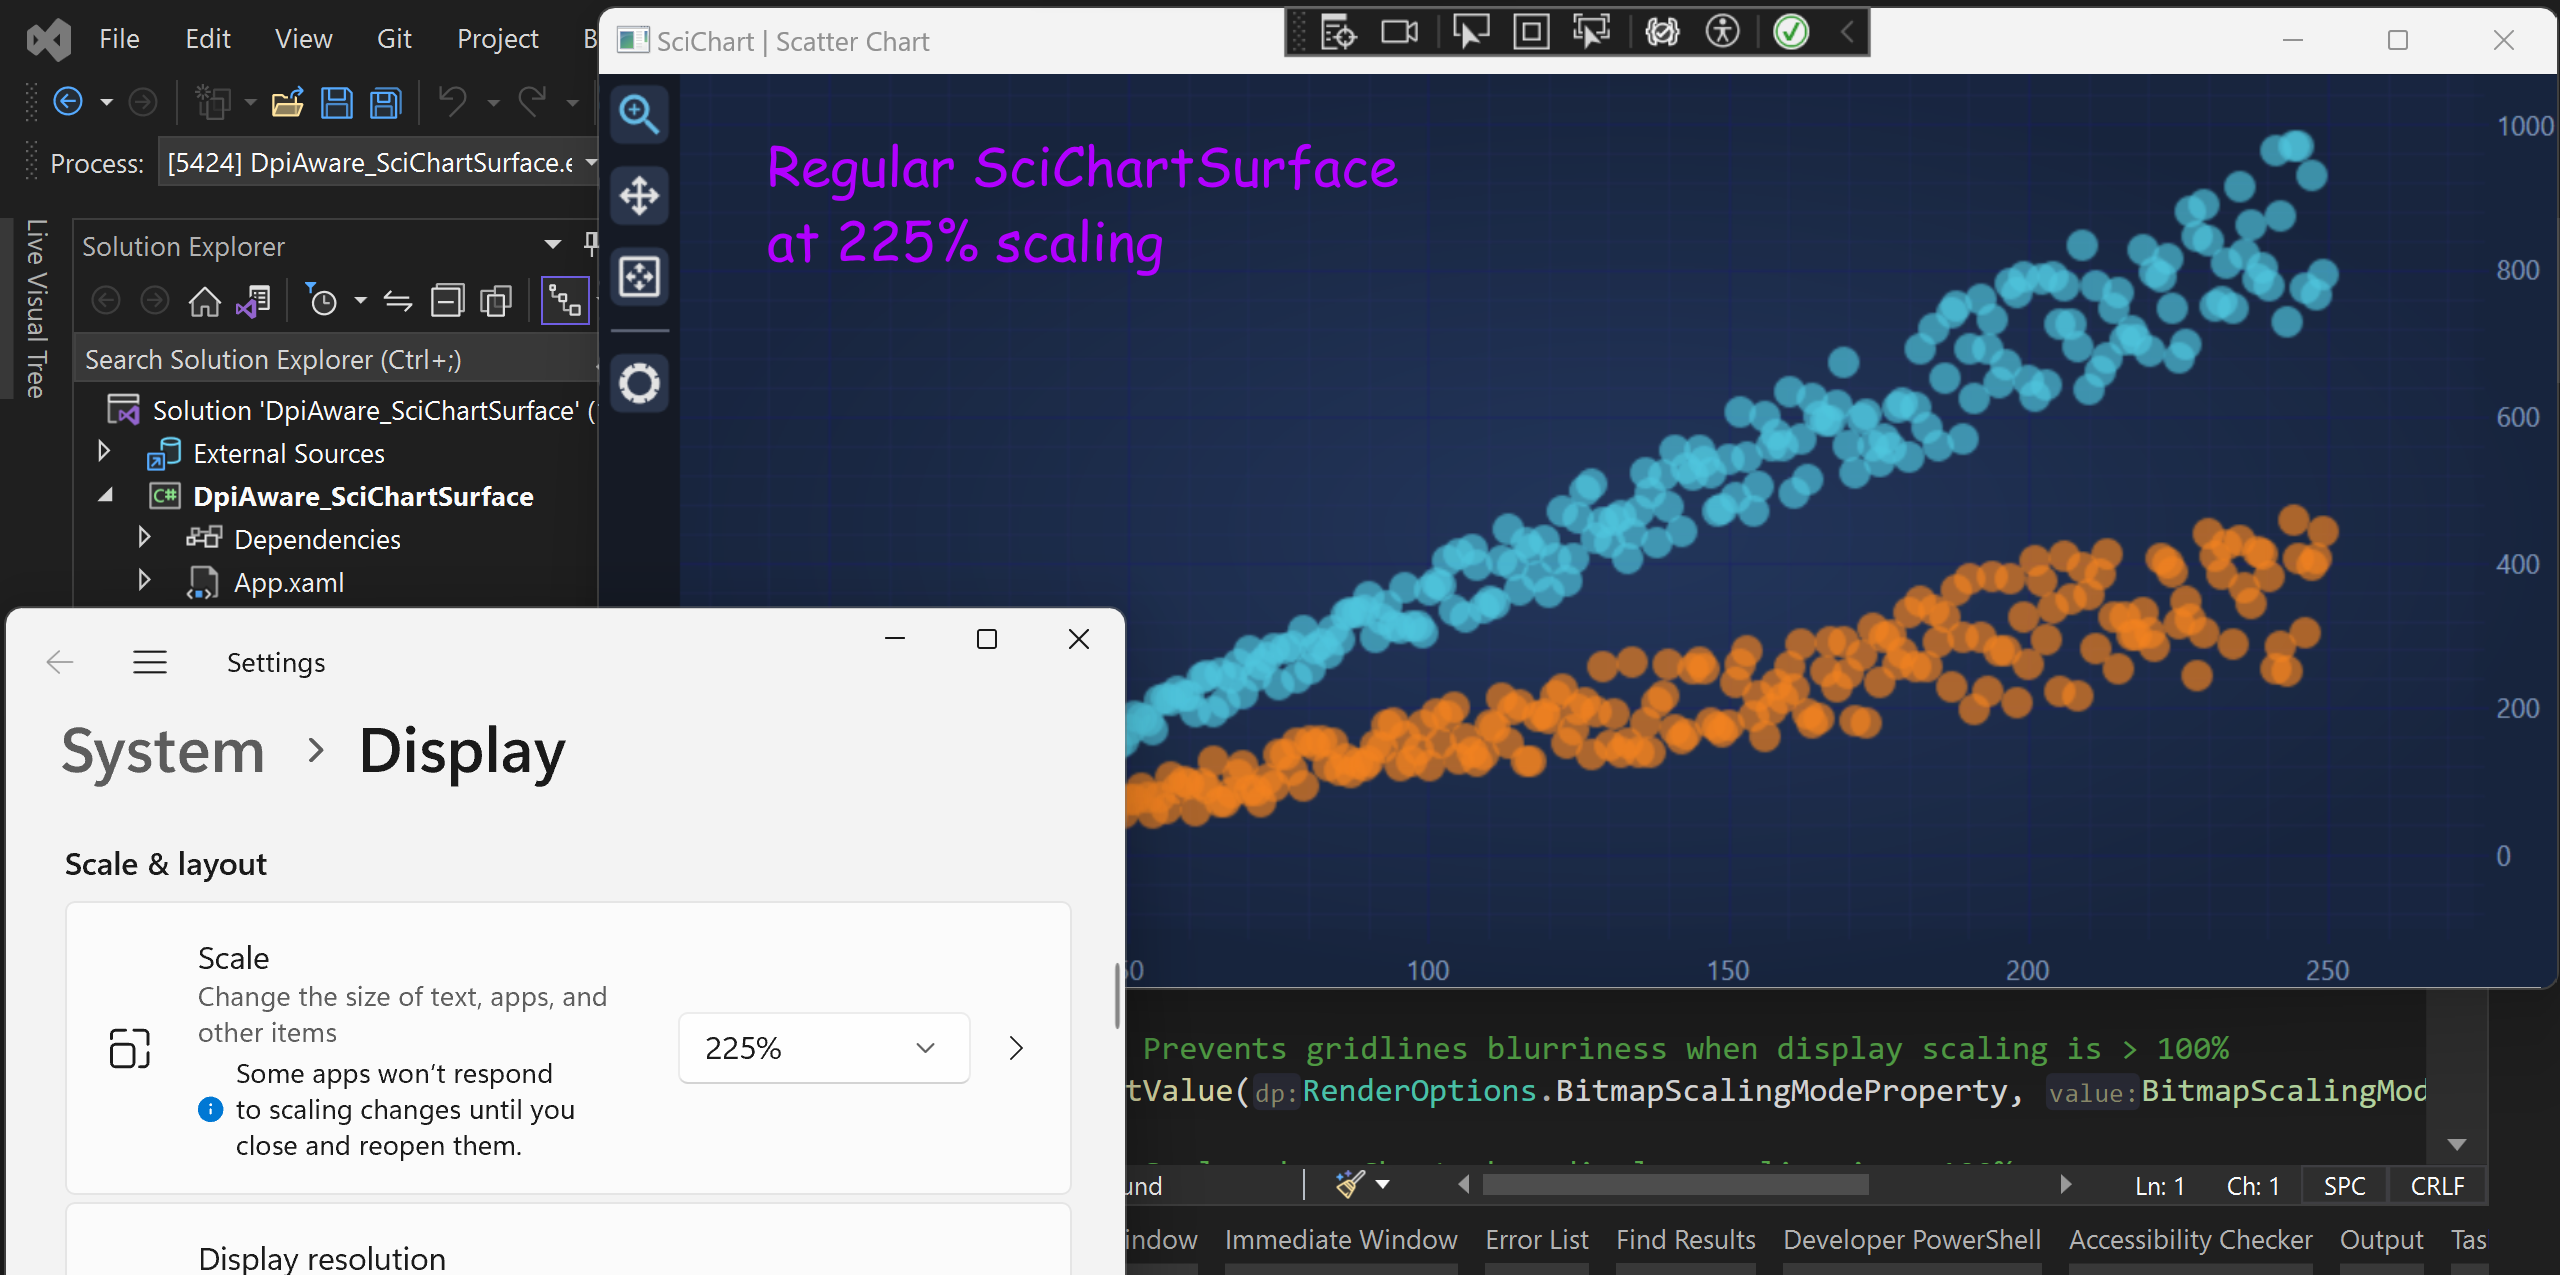
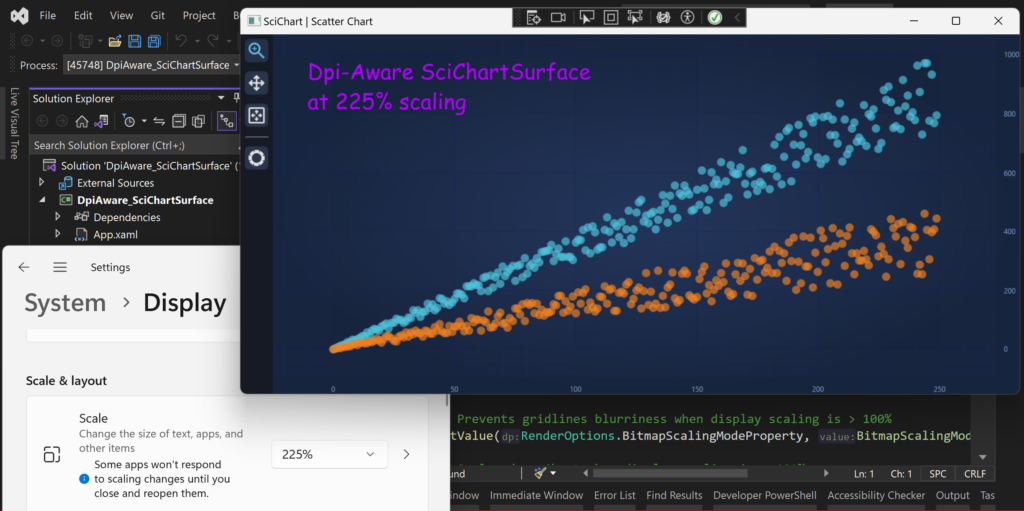
Added a new example that demonstrates how to configure a 2D chart to render scaled-down.
From time to time our customers ask how to make a resolution-independent chart. This is important for use-cases where multiple scaling levels (or displays) have to be supported by an application that contains charts. When at high-scaling levels, default SciChart charts may appear blurry because it relies on raster graphics.
While SciChart doesn’t support such use-cases out of the box, there is a solution available. It is to scale SciChartSurface down using WPF capabilities (applying a ScaleTransform). This appoach is demonstrated in our new example that can be found on SciChart GitHub:
This is a list of breaking changes in SciChart SDK v8.0.
Changes in SciChart 3D APIs
Changes in SciChart 2D APIs
Changes in the IRenderContext API
SciChart WPF v8.0 is available by:
Please ensure you uninstall the previous version(s) of SciChart before installing the latest version as this can prevent some issues in the upgrade process!
We welcome your feedback! Please let us know what you think about our new features, examples and improvements. You can contact our friendly, helpful team at any time!
Related Posts
![]()
Queens Award for Innovation
Proud winners of the Queens Award for Innovation, 2019. Awarded on account of our innovative graphics engine which underpins the SciChart library and enables our world-beating charting performance
![]()
National Business Awards
Highly Commended for Lloyds National Business Awards, 2019. Awarded on account of our innovative graphics engine and impressive customer base
![]()
National Technology Awards
Awarded “Healthcare Tech of the Year” at the 2025 National Technology Awards – a top UK recognition for breakthrough innovation in technology.

Reviews
SciChart has received hundreds of verified, 3rd party reviews