We are pleased to announce that the SciChart WPF v6.3 build 13476, has now been released! This update includes a number of bug fixes and minor enhancements requested by users since version 6.2.x. This release is a drop-in replacement for 6.x and it is recommended for all users to update.
What’s New in SciChart v6.3?
1) .NET 5 Support
SciChart WPF library has been tested to work in .NET 5 applications! Please also note that SciChart WPF Library has upgraded to NetCore 3.1.
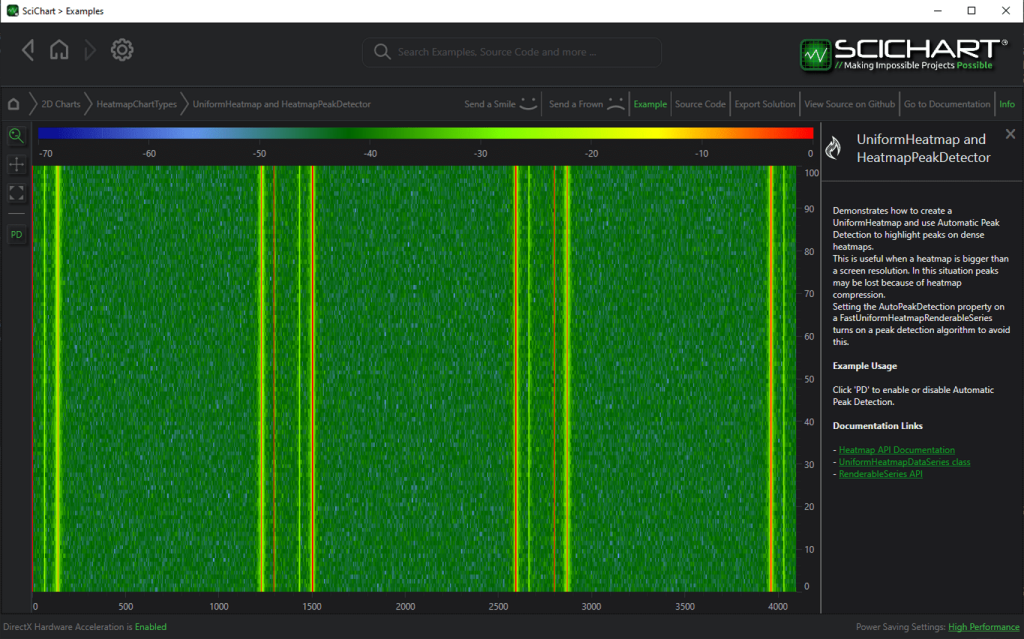
2) Heatmap Peak detector Feature
This is a new feature requested by many customers of SciChart WPF. When a heatmap dimension exceeds the corresponding screen dimension the peaks can be lost because of the heatmap compression, so it becomes important to find and show those.
The Heatmap Peak Detector example demonstrates how to create a WPF 2D Uniform Heatmap and use Automatic Peak Detection to highlight the peaks.
Simply setting the AutoPeakDetection property on a FastUniformHeatmapRenderableSeries in SciChart turns on peak detection algorithm.
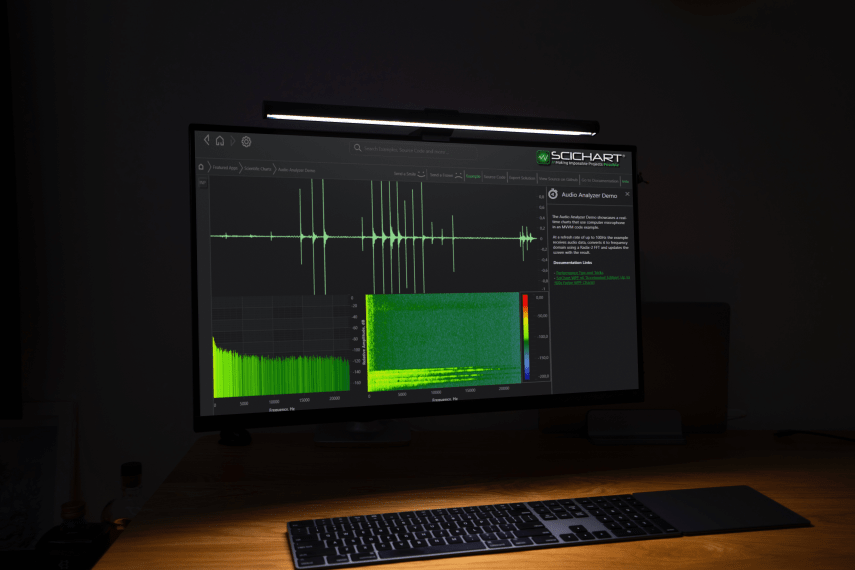
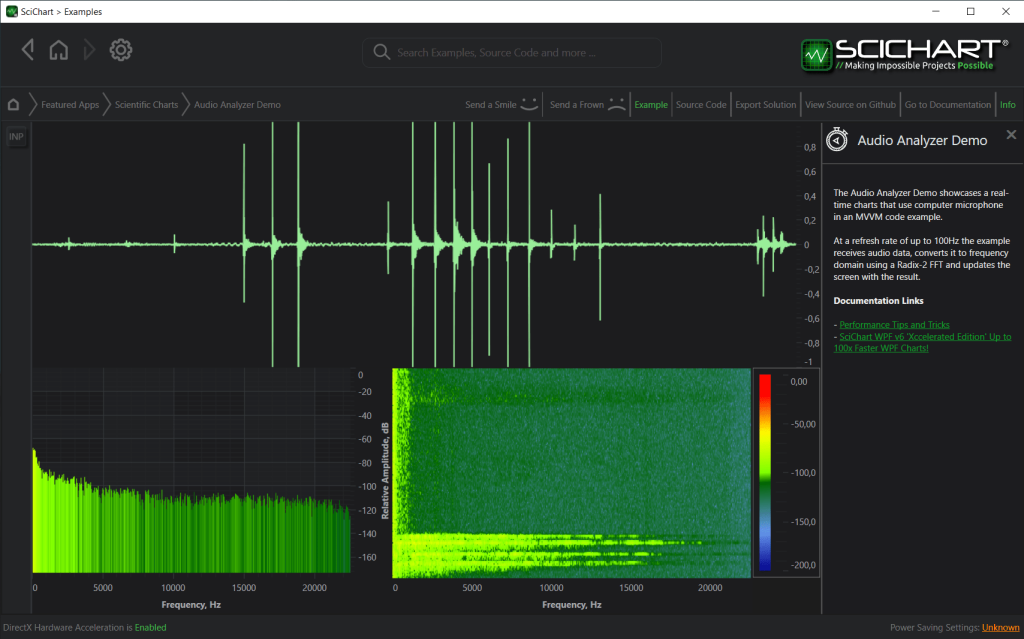
The Audio Analyzer demo showcases realtime charts that use computer microphone.
At a refresh rate of up to 100 Hz the example receives audio data and creates a waveform of the sounds, that you can see in the top chart.
The example next converts the audio data to a frequency domain using a Radix-2FFT and updates the screen with the result in form of the column chart on the lower left side and the spectrogram, created with heatmap on the right.
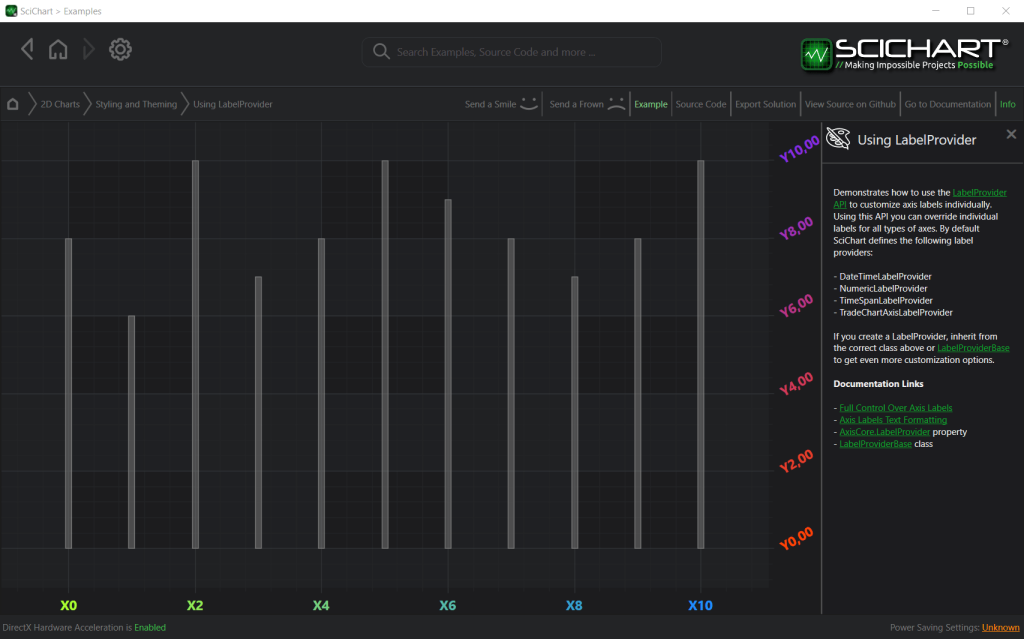
SciChart API is designed to be very flexible. You can customize every element of the chart to your needs. We have created an example that demonstrates how to customize axis labels individually with the LabelProviderAPI.
Using this API, you can override individual labels for all types of axes.
SC-5575 Fixed: HistobarRenderableSeries cannot be added as HistobarRenderableSeriesViewModel
SC-5574 Fixed: issue when Legend could be empty in SciStockChart with enabled Cursor/Rollover modifier
SC-5559 Fixed: When hit testing a 3D mesh, the HitTest() fails until the chart is either zoomed or resized
SC-5565 Fixed: VisibleRangeChanged is not raised for DateTimeAxisViewModel
SC-5563 Fixed: bugs with horizontal scroll bar, RubberBandXyZoom, and ZoomExtents Modifiers on the touchscreen
SC-5566 Fixed: The color of the FastBubbleRenderableSeries swaps between blue and red when IPaletteProvider is used
SC-5477 Fixed: Dashed line doesn’t work on stacked mountain series
SC-5560 Fixed: System.InvalidOperationException when “SciChart Trader Demo” example is launched
Fixed: dashed lines in stacked mountain series, bands and mountain series
SC-5553 Fixed: System.AccessViolationException: ‘Attempted to read or write protected memory’ when PaletteProvider is used for Scatter Series
SC-5554 Fixed: System.NullReferenceException when annotation is deleted from the collection
SC-5555 Fixed: Memory leak for annotation labels when view-models are switched
SC-5523 Fixed: unhandled exception in LiDAR example
SC-5548 Fixed: 2 of 4 resize grips of the BoxAnnotations do not work on the vertical chart
SC-5527 Fixed: VerticalLineAnnotation doesn’t reach the first RenderableSeries point if you move it to the left
SC-5542 Fixed: Transparent Stroke Color set by PaletteProvider changes RenderableSeries Shape
SC-5543 Fixed: Stroke Color set by PaletteProvider is not applied to RenderableSeries when VisualXcceleratorEngine is enabled
SC-5502 Fixed: Y-values mismatch after panning the chart to the left
SC-5500 Fixed: VerticalSliceModifier.VerticalLines with RelativeCoordinateMode doesn’t display tooltip in correct location
SC-5545 Fixed: the issue when users couldn’t implement IPointMetadata3D because of direct casts in XyzDataSeries3D
SC-5529 Fixed: Changing Color in ExamplePointCloudPaletteProvider in the “Simple Select Scatter Point 3D Chart” example doesn’t change the selected PointMarker color
SC-549 and SC-5501 Fixed: DoubleScaleDiscontinuousDateTimeAxis. The bottom labels are overlapped and drawn in wrong place
SC-5528 Fixed: System.ArgumentNullException, value cannot be null appears when Visual Xccelerator Engine is enabled
SC-5536 Fixed: System.TypeInitializationException when a view-model is created in code and don’t used in a surface in XAML
SC-5507 Fixed: The YStrokeColorMapping property does not apply to WaterfallRenderableSeries3D
SC-5511 Fixed: 3D Memory leak with AccessViolationException and InvalidOperationException: Native collection has been destructed!
SC-5504 Fixed: Surface doesn’t render Or AccessViolationException
Please ensure you uninstall the previous version(s) of SciChart before installing the latest version as this can prevent some issues in the upgrade process!
Pricing and Licensing
SciChart WPF v6.3 is free of charge to customers with an active Support-Subscription.
For new customers, please find our pricing at our store page.
If your support has expired and you would like to get access to the improvements & fixes in this release, contact-sales and we will prepare you a renewal quote.
Queens Award for Innovation Proud winners of the Queens Award for Innovation, 2019. Awarded on account of our innovative graphics engine which underpins the SciChart library and enables our world-beating charting performance
National Business Awards Highly Commended for Lloyds National Business Awards, 2019. Awarded on account of our innovative graphics engine and impressive customer base
National Technology Awards Awarded “Healthcare Tech of the Year” at the 2025 National Technology Awards – a top UK recognition for breakthrough innovation in technology.
Reviews SciChart has received hundreds of verified, 3rd party reviews
Try SciChart Today
Start a trial and discover why we are the choice of demanding developers worldwide