WPF Chart - Examples
SciChart WPF ships with hundreds of WPF Chart Examples which you can browse, play with, view the source-code and even export each WPF Chart Example to a stand-alone Visual Studio solution. All of this is possible with the new and improved SciChart WPF Examples Suite, which ships as part of the SciChart WPF SDK.
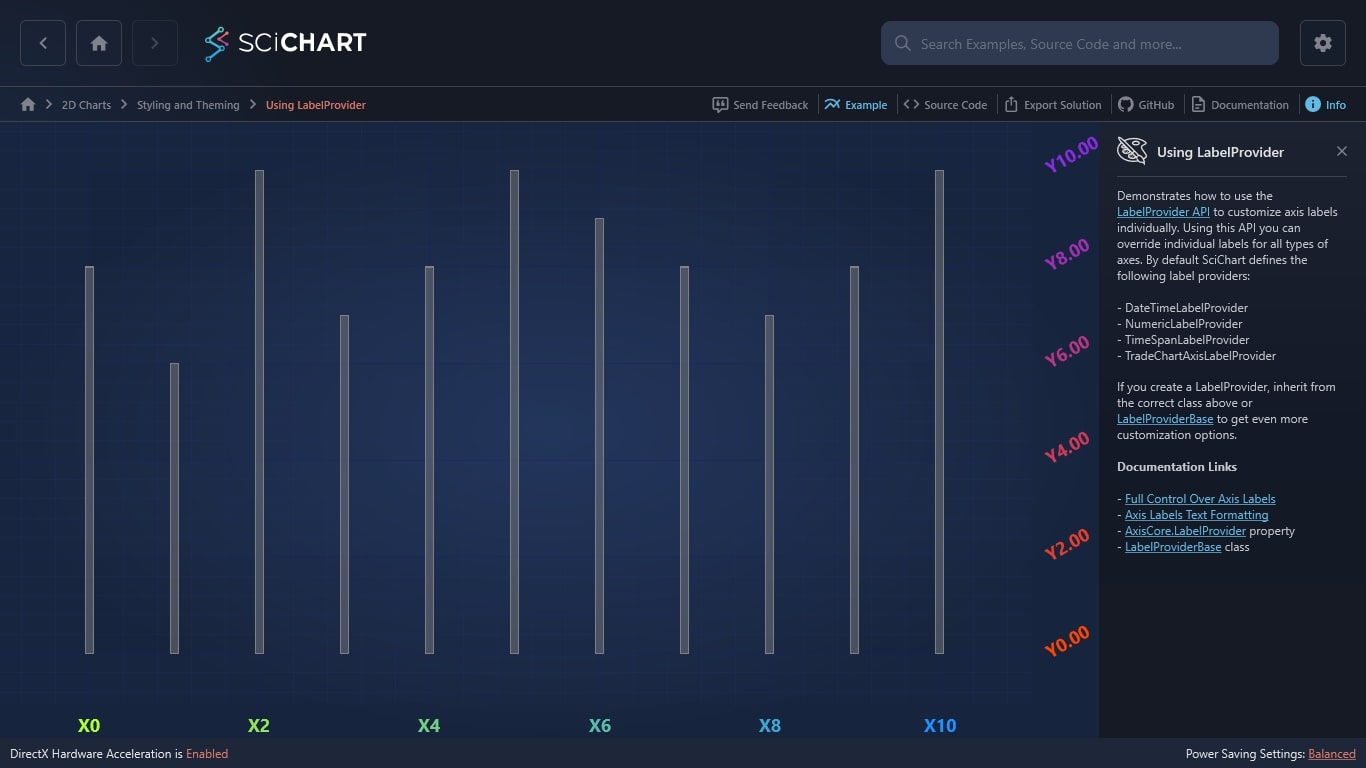
SciChart API is designed to be very flexible. You can customize every element of the chart to your needs. We have created an example that demonstrates how to customize axis labels individually with the LabelProviderAPI. Using this API you can override individual labels for all types of axes. By default SciChart WPF defines the following label providers: DateTimeLabelProvider, NumericLabelProvider, TimeSpanLabelProvider, TradeChartAxisLabelProvider.
If you create a LabelProvider, inherit from the correct class above or LabelProviderBase to get even more customization options.
Documentation links:
– Full Control Over Axis Labels
– Axis Labels Text Formatting
– AxisCoreLabelProvider property
– LabelProviderBase class

The C#/WPF source code for the WPF Using Label Provider example is included below (Scroll down!).
Did you know you can also view the source code from one of the following sources as well?
- Clone the SciChart.WPF.Examples from Github.
- Or, view source in the SciChart WPF Examples suite.
- Also the SciChart WPF Trial contains the full source for the examples (link below).
UseLabelProvider.xaml
View source code<UserControl x:Class="SciChart.Examples.Examples.StyleAChart.UseLabelProvider.UseLabelProvider"
xmlns="http://schemas.microsoft.com/winfx/2006/xaml/presentation"
xmlns:x="http://schemas.microsoft.com/winfx/2006/xaml"
xmlns:s="http://schemas.abtsoftware.co.uk/scichart">
<Grid>
<Grid.Resources>
<Style x:Key="CustomTickLabelStyle" TargetType="s:DefaultTickLabel">
<Setter Property="Foreground" Value="{Binding Foreground, Mode=OneWay}"/>
<Setter Property="FontSize" Value="{Binding FontSize, Mode=OneWay}"/>
<Setter Property="FontWeight" Value="{Binding FontWeight, Mode=OneWay}"/>
<Setter Property="RenderTransform">
<Setter.Value>
<RotateTransform Angle="{Binding Angle, Mode=OneWay}"/>
</Setter.Value>
</Setter>
</Style>
</Grid.Resources>
<s:SciChartSurface x:Name="sciChartSurface">
<s:SciChartSurface.XAxis>
<s:NumericAxis x:Name="xAxis"
MinHeight="30"
GrowBy="0.1,0.1"
TickLabelStyle="{StaticResource CustomTickLabelStyle}"/>
</s:SciChartSurface.XAxis>
<s:SciChartSurface.YAxis>
<s:NumericAxis x:Name="yAxis"
MinWidth="60"
GrowBy="0.1,0.1"
TickLabelStyle="{StaticResource CustomTickLabelStyle}"/>
</s:SciChartSurface.YAxis>
<s:SciChartSurface.RenderableSeries>
<s:FastColumnRenderableSeries x:Name="columnSeries"
DataPointWidth="0.1"
Stroke="#FF808080"
Fill="#77808080"/>
</s:SciChartSurface.RenderableSeries>
<s:SciChartSurface.ChartModifier>
<s:ModifierGroup>
<s:ZoomPanModifier/>
<s:ZoomExtentsModifier/>
<s:MouseWheelZoomModifier/>
</s:ModifierGroup>
</s:SciChartSurface.ChartModifier>
</s:SciChartSurface>
</Grid>
</UserControl>UseLabelProvider.xaml.cs
View source codeusing System.Windows;
using System.Windows.Controls;
using System.Windows.Media;
using SciChart.Charting.Model.DataSeries;
namespace SciChart.Examples.Examples.StyleAChart.UseLabelProvider
{
public partial class UseLabelProvider : UserControl
{
public UseLabelProvider()
{
InitializeComponent();
Loaded += OnLoaded;
}
private void OnLoaded(object sender, RoutedEventArgs e)
{
xAxis.LabelProvider = new CustomLabelProvider(new CustomLabelParams
{
ColorFrom = Colors.GreenYellow,
ColorTo = Colors.DodgerBlue,
ValueFrom = 0,
ValueTo = 10,
LabelAngle = 0,
LabelFormat = "X{0}"
});
yAxis.LabelProvider = new CustomLabelProvider(new CustomLabelParams
{
ColorFrom = Colors.OrangeRed,
ColorTo = Colors.BlueViolet,
ValueFrom = 0,
ValueTo = 10,
LabelAngle = -30,
LabelFormat = "Y{0:N2}"
});
var dataSeries = new UniformXyDataSeries<double>();
var yValues = new[] {8, 6, 10, 7, 8, 10, 9, 8, 7, 8, 10};
using (sciChartSurface.SuspendUpdates())
{
for (int i = 0; i < yValues.Length; i++)
{
dataSeries.Append(yValues[i]);
}
}
columnSeries.DataSeries = dataSeries;
sciChartSurface.ZoomExtents();
}
}
}