WPF Chart - Examples
SciChart WPF ships with hundreds of WPF Chart Examples which you can browse, play with, view the source-code and even export each WPF Chart Example to a stand-alone Visual Studio solution. All of this is possible with the new and improved SciChart WPF Examples Suite, which ships as part of the SciChart WPF SDK.
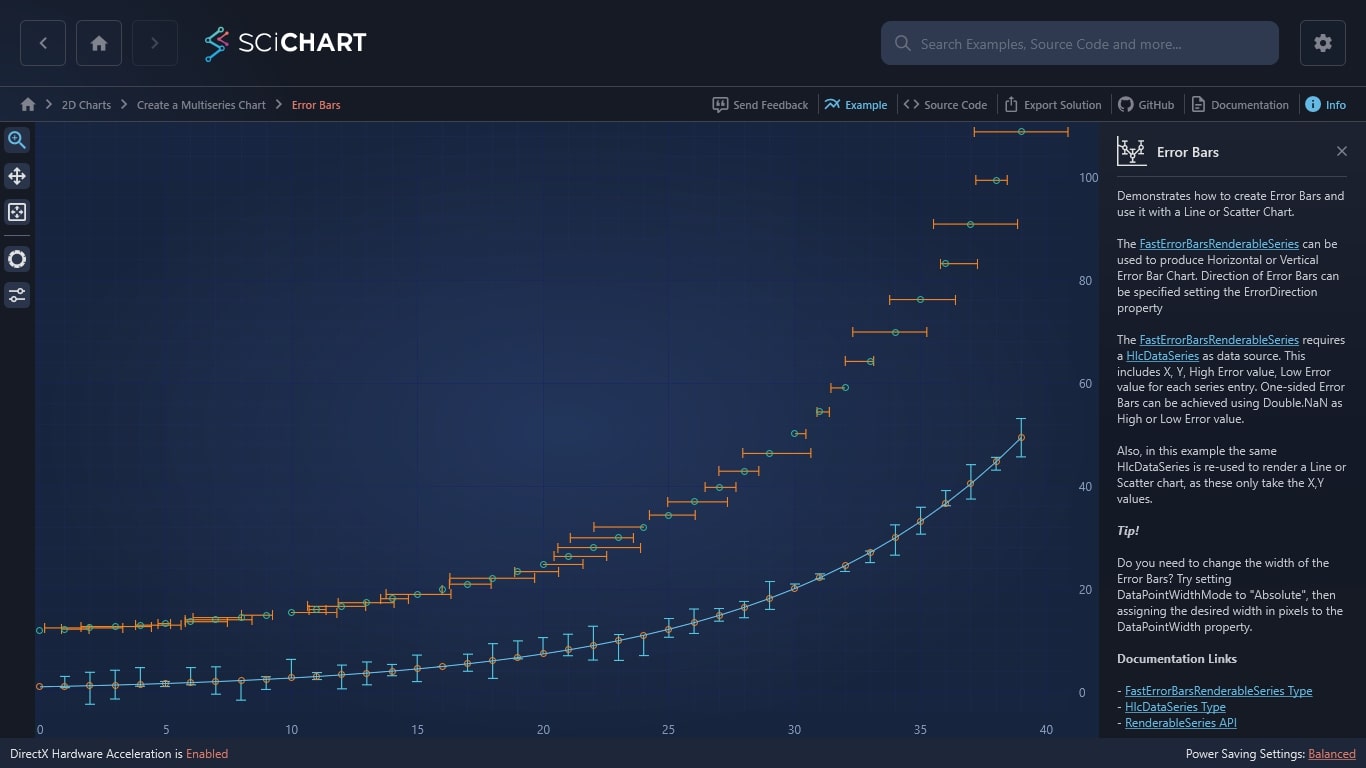
Demonstrates how to create Error Bars and use it with a WPF Line or Scatter Chart.
The FastErrorBarsRenderableSeries can be used to produce Horizontal or Vertical Error Bar Chart. Direction of Error Bars can be specified setting the ErrorDirection property.
The FastErrorBarsRenderableSeries requires a HlcDataSeries as data source. This includes X,Y, High Error value, Low Error value for each series entry. One-sided Error Bars can be achieved using Double.NaN as High or Low Error value. Also in this example the same HlcDataSeries is re-used to render a Line or Scatter chart, as these only take the X,Y values.
Tip!
Do you need to change the width of the Error Bars? Try setting DataPointWidthMode to “Absolute”, then assigning the desired width in pixels to the DataPointWidth property.
Documentation Links
– FastErrorBarsRenderableSeries Type
– HlcDataSeries Type
– RenderableSeries API

The C#/WPF source code for the WPF Chart Error Bars example is included below (Scroll down!).
Did you know you can also view the source code from one of the following sources as well?
- Clone the SciChart.WPF.Examples from Github.
- Or, view source in the SciChart WPF Examples suite.
- Also the SciChart WPF Trial contains the full source for the examples (link below).
ErrorSeriesExampleView.xaml
View source code<UserControl x:Class="SciChart.Examples.Examples.CreateMultiseriesChart.ErrorSeriesExampleView"
xmlns="http://schemas.microsoft.com/winfx/2006/xaml/presentation"
xmlns:x="http://schemas.microsoft.com/winfx/2006/xaml"
xmlns:s="http://schemas.abtsoftware.co.uk/scichart"
xmlns:mc="http://schemas.openxmlformats.org/markup-compatibility/2006"
xmlns:d="http://schemas.microsoft.com/expression/blend/2008"
xmlns:ext="http://schemas.abtsoftware.co.uk/scichart/exampleExternals"
d:DesignHeight="400"
d:DesignWidth="600"
mc:Ignorable="d">
<Grid>
<Grid.ColumnDefinitions>
<ColumnDefinition Width="Auto" />
<ColumnDefinition Width="*" />
</Grid.ColumnDefinitions>
<!-- The SciChartInteractionToolbar adds zoom, pan, zoom extents and rotate functionality -->
<!-- to the chart and is included for example purposes. -->
<!-- If you wish to know how to zoom and pan a chart then do a search for Zoom Pan in the Examples suite! -->
<ext:SciChartInteractionToolbar TargetSurface="{Binding Source={x:Reference Name=sciChart}}" >
<ext:FlyoutMenuButton Style="{StaticResource FlyoutMenuButtonStyle}" Content="BAR" Padding="0">
<ext:FlyoutMenuButton.PopupContent>
<StackPanel Orientation="Vertical" MinWidth="150">
<TextBlock Text="ErrorBars.DataPointWidth" />
<ext:FlyoutSeparator/>
<Slider Margin="4,0" Minimum="0.0" Maximum="40.0" Orientation="Horizontal" Value="{Binding DataPointWidth, Mode=TwoWay, UpdateSourceTrigger=PropertyChanged}" />
<TextBlock Text="ErrorBars.StrokeThickness" Margin="4,16,4,4"/>
<ext:FlyoutSeparator/>
<Slider Margin="4,0,4,10" Maximum="5.0" Minimum="1.0" Orientation="Horizontal" Value="{Binding StrokeThickness, Mode=TwoWay, UpdateSourceTrigger=PropertyChanged}" />
</StackPanel>
</ext:FlyoutMenuButton.PopupContent>
</ext:FlyoutMenuButton>
</ext:SciChartInteractionToolbar>
<s:SciChartSurface Grid.Column="1" Padding="0" BorderThickness="0" x:Name="sciChart">
<s:SciChartSurface.RenderableSeries>
<!-- Line and Error series are bound to the same (first) ErrorDataSeries -->
<!-- The line series uses X Y points from the DataSeries, but ErrorBars renderable series uses X Y YHigh YLow -->
<s:FastErrorBarsRenderableSeries x:Name="errorSeries1"
DataPointWidthMode="Absolute"
DataPointWidth="{Binding DataPointWidth, Mode=OneWay}"
DataSeries="{Binding DataSeries0, Mode=OneWay}"
StrokeThickness="{Binding StrokeThickness, Mode=OneWay}"
Stroke="Blue"
ErrorDirection="YAxis">
<s:FastErrorBarsRenderableSeries.SeriesAnimation>
<s:SweepAnimation AnimationDelay="0:0:1" Duration="0:0:3"/>
</s:FastErrorBarsRenderableSeries.SeriesAnimation>
<s:FastErrorBarsRenderableSeries.PointMarker>
<s:EllipsePointMarker Width="7"
Height="7"
Fill="Transparent"
Stroke="White" />
</s:FastErrorBarsRenderableSeries.PointMarker>
</s:FastErrorBarsRenderableSeries>
<s:FastLineRenderableSeries DataSeries="{Binding DataSeries0, Mode=OneWay}"
StrokeThickness="{Binding StrokeThickness, Mode=OneWay}">
<s:FastLineRenderableSeries.SeriesAnimation>
<s:SweepAnimation AnimationDelay="0:0:1" Duration="0:0:3"/>
</s:FastLineRenderableSeries.SeriesAnimation>
</s:FastLineRenderableSeries>
<!-- Scatter and Error series are bound to the same (second) ErrorDataSeries -->
<!-- The line series uses X Y points from the DataSeries, but ErrorBars renderable series uses X Y YHigh YLow -->
<s:FastErrorBarsRenderableSeries x:Name="errorSeries2"
DataPointWidthMode="Absolute"
DataPointWidth="{Binding DataPointWidth, Mode=OneWay}"
DataSeries="{Binding DataSeries1, Mode=OneWay}"
StrokeThickness="{Binding StrokeThickness, Mode=OneWay}"
Stroke="Green"
ErrorDirection="XAxis">
<s:FastErrorBarsRenderableSeries.SeriesAnimation>
<s:SweepAnimation AnimationDelay="0:0:1" Duration="0:0:3"/>
</s:FastErrorBarsRenderableSeries.SeriesAnimation>
<s:FastErrorBarsRenderableSeries.PointMarker>
<s:EllipsePointMarker Width="7"
Height="7"
Fill="Transparent"
Stroke="White" />
</s:FastErrorBarsRenderableSeries.PointMarker>
</s:FastErrorBarsRenderableSeries>
</s:SciChartSurface.RenderableSeries>
<s:SciChartSurface.XAxis>
<s:NumericAxis DrawMajorBands="True"/>
</s:SciChartSurface.XAxis>
<s:SciChartSurface.YAxis>
<s:NumericAxis DrawMajorBands="True" GrowBy="0.01, 0.01"/>
</s:SciChartSurface.YAxis>
</s:SciChartSurface>
</Grid>
</UserControl>ErrorSeriesExampleView.xaml.cs
View source code// *************************************************************************************
// SCICHART® Copyright SciChart Ltd. 2011-2022. All rights reserved.
//
// Web: http://www.scichart.com
// Support: support@scichart.com
// Sales: sales@scichart.com
//
// ErrorSeriesExampleView.xaml.cs is part of the SCICHART® Examples. Permission is hereby granted
// to modify, create derivative works, distribute and publish any part of this source
// code whether for commercial, private or personal use.
//
// The SCICHART® examples are distributed in the hope that they will be useful, but
// without any warranty. It is provided "AS IS" without warranty of any kind, either
// expressed or implied.
// *************************************************************************************
using System;
using System.Windows.Controls;
using System.Windows.Media.Animation;
using SciChart.Charting.Visuals.RenderableSeries.Animations;
namespace SciChart.Examples.Examples.CreateMultiseriesChart
{
/// <summary>
/// Interaction logic for ErrorSeriesExampleView.xaml
/// </summary>
public partial class ErrorSeriesExampleView : UserControl
{
public ErrorSeriesExampleView()
{
InitializeComponent();
}
}
}
ErrorSeriesExampleViewModel.cs
View source code// *************************************************************************************
// SCICHART® Copyright SciChart Ltd. 2011-2022. All rights reserved.
//
// Web: http://www.scichart.com
// Support: support@scichart.com
// Sales: sales@scichart.com
//
// ErrorSeriesExampleViewModel.cs is part of the SCICHART® Examples. Permission is hereby granted
// to modify, create derivative works, distribute and publish any part of this source
// code whether for commercial, private or personal use.
//
// The SCICHART® examples are distributed in the hope that they will be useful, but
// without any warranty. It is provided "AS IS" without warranty of any kind, either
// expressed or implied.
// *************************************************************************************
using System;
using System.Linq;
using SciChart.Charting.Model.DataSeries;
using SciChart.Examples.ExternalDependencies.Common;
using SciChart.Examples.ExternalDependencies.Data;
namespace SciChart.Examples.Examples.CreateMultiseriesChart
{
public class ErrorSeriesExampleViewModel : BaseViewModel
{
private double _dataPointWidth = 10;
private int _strokeThickness = 1;
public ErrorSeriesExampleViewModel()
{
// Generate some data to display
DataManager.Instance.SetRandomSeed(seed: 0);
var data0 = DataManager.Instance.GetExponentialCurve(40);
// Append data to series. SciChart automatically redraws
DataSeries0 = new HlcDataSeries<double, double>();
DataSeries1 = new HlcDataSeries<double, double>();
FillSeries(DataSeries0, data0, 1.0, 0.0, 4.0, false);
FillSeries(DataSeries1, data0, 2.0, 10.0, 2.0, true);
}
private void FillSeries(HlcDataSeries<double, double> hlcDataSeries, DoubleSeries sourceData, double yDataScale, double yOffset, double errorScale, bool isHorizontalError)
{
var xData = sourceData.XData;
var yData = sourceData.YData.Select(x => x * yDataScale + yOffset).ToArray();
// Generate some random error data. Errors must be absolute values,
// e.g. if a series has a Y-value of 5.0, and YError of =/-10% then you must enter YErrorHigh=5.5, YErrorLow=4.5 into the HlcDataSeries
var random = new RandomWalkGenerator(seed: 0);
var errorBase = isHorizontalError ? xData : yData;
var yErrorHigh = errorBase.Select((y, index) => index % 8 == 0 ? double.NaN : y + (random.GetRandomDouble() * errorScale));
var yErrorLow = errorBase.Select((y, index) => index % 10 == 0 ? double.NaN : y - (random.GetRandomDouble() * errorScale));
// HlcDataSeries requires X, Y, High, Low.
// For Error bars the High, Low becomes the High Low error,
// while X,Y is the location of the error
hlcDataSeries.Append(xData, yData, yErrorHigh, yErrorLow);
}
// Note: No need to implement INotifyPropertyChanged here since we're not updating the series instances
public HlcDataSeries<double, double> DataSeries0 { get; private set; }
public HlcDataSeries<double, double> DataSeries1 { get; private set; }
public double DataPointWidth
{
get => _dataPointWidth;
set
{
_dataPointWidth = value;
OnPropertyChanged(nameof(DataPointWidth));
}
}
public int StrokeThickness
{
get => _strokeThickness;
set
{
_strokeThickness = value;
OnPropertyChanged(nameof(StrokeThickness));
}
}
}
}