
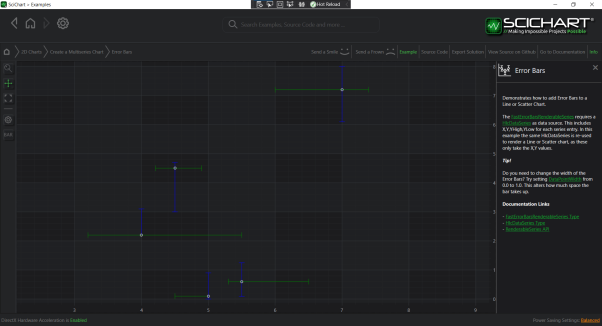
Error Bars are provided by the FastErrorBarsRenderableSeries type. This accepts data from a HlcDataSeries (X,Y, ErrorHigh, ErrorLow) and renders vertical (above and below the Y-value) or horizontal (to the sides of the Y-value) Error Bars.
Examples for the Error ars Chart can be found in the SciChart WPF Examples Suite which can be downloaded from the SciChart Website or our SciChart.WPF.Examples Github Repository.
NOTE: For info about XyzDataSeries, as well as other DataSeries types in SciChart, see DataSeries API
To declare a FastErrorBarsRenderableSeries, use the following code:
Declare a FastErrorBarsRenderableSeries in Xaml / Code Behind
| Declare a FastErrorBarsRenderableSeries in Xaml |
Copy Code |
|---|---|
<!-- where xmlns:s="http://schemas.abtsoftware.co.uk/scichart" --> <s:SciChartSurface> <s:SciChartSurface.RenderableSeries> <!-- ErrorDirection specifies that ErrorBars should appear along YAxis, i.e. vertical ErrorBars --> <!-- DataPointWidthMode specifies that DataPointWidth is set in relative units, in [0..1] range --> <s:FastErrorBarsRenderableSeries x:Name="rSeries" Stroke="GreenYellow" StrokeThickness="1" AntiAliasing="False" ErrorDirection="YAxis" DataPointWidthMode="Relative" DataPointWidth="0.8"/> </s:SciChartSurface.RenderableSeries> <!-- XAxis, YAxis omitted for brevity --> </s:SciChartSurface> | |
| Declare a FastErrorBarsRenderableSeries in Code Behind |
Copy Code |
|---|---|
// Code Behind, e.g. in OnLoaded event handler, set the DataSeries var hlcDataSeries = new HlcDataSeries<double, double>(); // FastErrorBarsRenderableSeries expects data in the format X,Y plus High (error high), Low (error low) hlcDataSeries.Append(0, 0, 0.5, -0.5); hlcDataSeries.Append(1, 1, 1.5, 0.8); hlcDataSeries.Append(2, 0.5, 0.7, 0.4); hlcDataSeries.Append(3, 0.7, 0.6, 1.0); rSeries.DataSeries = hlcDataSeries; | |
Declare a FastErrorBarsRenderableSeries in Pure Code
| Declare a FastErrorBarsRenderableSeries in Pure Code |
Copy Code |
|---|---|
// Declare the SciChartSurface var sciChartSurface = new SciChartSurface(); // ... // Declare and add a Error Bars Series var errorBarsSeries = new FastErrorBarsRenderableSeries() { Stroke = Colors.GreenYellow, AntiAliasing = false, StrokeThickness = 1, // ErrorDirection specifies that ErrorBars should appear along YAxis, i.e. vertical ErrorBars ErrorDirection = ErrorDirection.YAxis, // DataPointWidthMode specifies that DataPointWidth is set in absolute units (pixels) DataPointWidthMode = DataPointWidthMode.Absolute, DataPointWidth = 15, }; // Set some data // FastErrorBarsRenderableSeries expects data in the format X,Y plus High (error high), Low (error low) var hlcDataSeries = new HlcDataSeries<double, double>(); hlcDataSeries.Append(0, 0, 0.5, -0.5); hlcDataSeries.Append(1, 1, 1.5, 0.8); hlcDataSeries.Append(2, 0.5, 0.7, 0.4); hlcDataSeries.Append(3, 0.7, 0.6, 1.0); errorBarsSeries.DataSeries = hlcDataSeries; | |
Horizontal or Vertical Error Bars
Direction of Error Bars can be specified via the ErrorDirection property of FastErrorBarsRenderableSeries. It accepts values from the ErrorDirection enumeration. By default, it is set to ErrorDirection.YAxis, which means that Error Bars will be drawn along Y-Axis, thus creating a vertical Error Bars chart.
| Setting direction of Error Bars |
Copy Code |
|---|---|
var errorBarsSeries = new FastErrorBarsRenderableSeries() { // ErrorDirection specifies that ErrorBars should appear along X-Axis, i.e. horizontal ErrorBars ErrorDirection = ErrorDirection.XAxis, ... } | |
One-Sided Error Bars
To make one-sided Error Bars, pass Double.NaN as low or high error value for a particular data point in HlcDataSeries:
| One-Sided Error Bars |
Copy Code |
|---|---|
var hlcDataSeries = new HlcDataSeries<double, double>(); // Specifies one-sided ErrorBar with low error value only hlcDataSeries.Append(0, 0, double.NaN, -0.5); | |
Error Bar Caps Width
Essentially width of Error Bars means the width of Error Bar caps. It is set via the DataPointWidth property on FastErrorBarsRenderableSeries.
The DataPointWidth can be interpreted as Relative or Absolute value. This is specified via the DataPointWidthMode property. The default value is DataPointWidthMode.Relative.
DataPointWidthMode.Relative means that DataPointWidth value is set in relative units. The value must fall into [0..1] range. Error Bar caps will not appear with DataPointWidth == “0”, while having DataPointWidth == “1” means that Error Bar caps will occupy all the space available for a single Error Bar.
| DataPointWidthMode.Relative |
Copy Code |
|---|---|
var errorBarsSeries = new FastErrorBarsRenderableSeries() { // DataPointWidthMode specifies that DataPointWidth is set in relative units (pixels) DataPointWidthMode = DataPointWidthMode.Relative, DataPointWidth = 0.8, ... }; | |
DataPointWidthMode.Absolute means that DataPointWidth value is set in absolute units (pixels). This means that ErrorBar caps will be DataPointWidth pixels long:
| DataPointWidthMode.Absolute |
Copy Code |
|---|---|
var errorBarsSeries = new FastErrorBarsRenderableSeries() { // DataPointWidthMode specifies that DataPointWidth is set in absolute units (pixels) DataPointWidthMode = DataPointWidthMode.Absolute, DataPointWidth = 15, ... }; | |